Free scoreboard
The weekly huddle,
on one page.
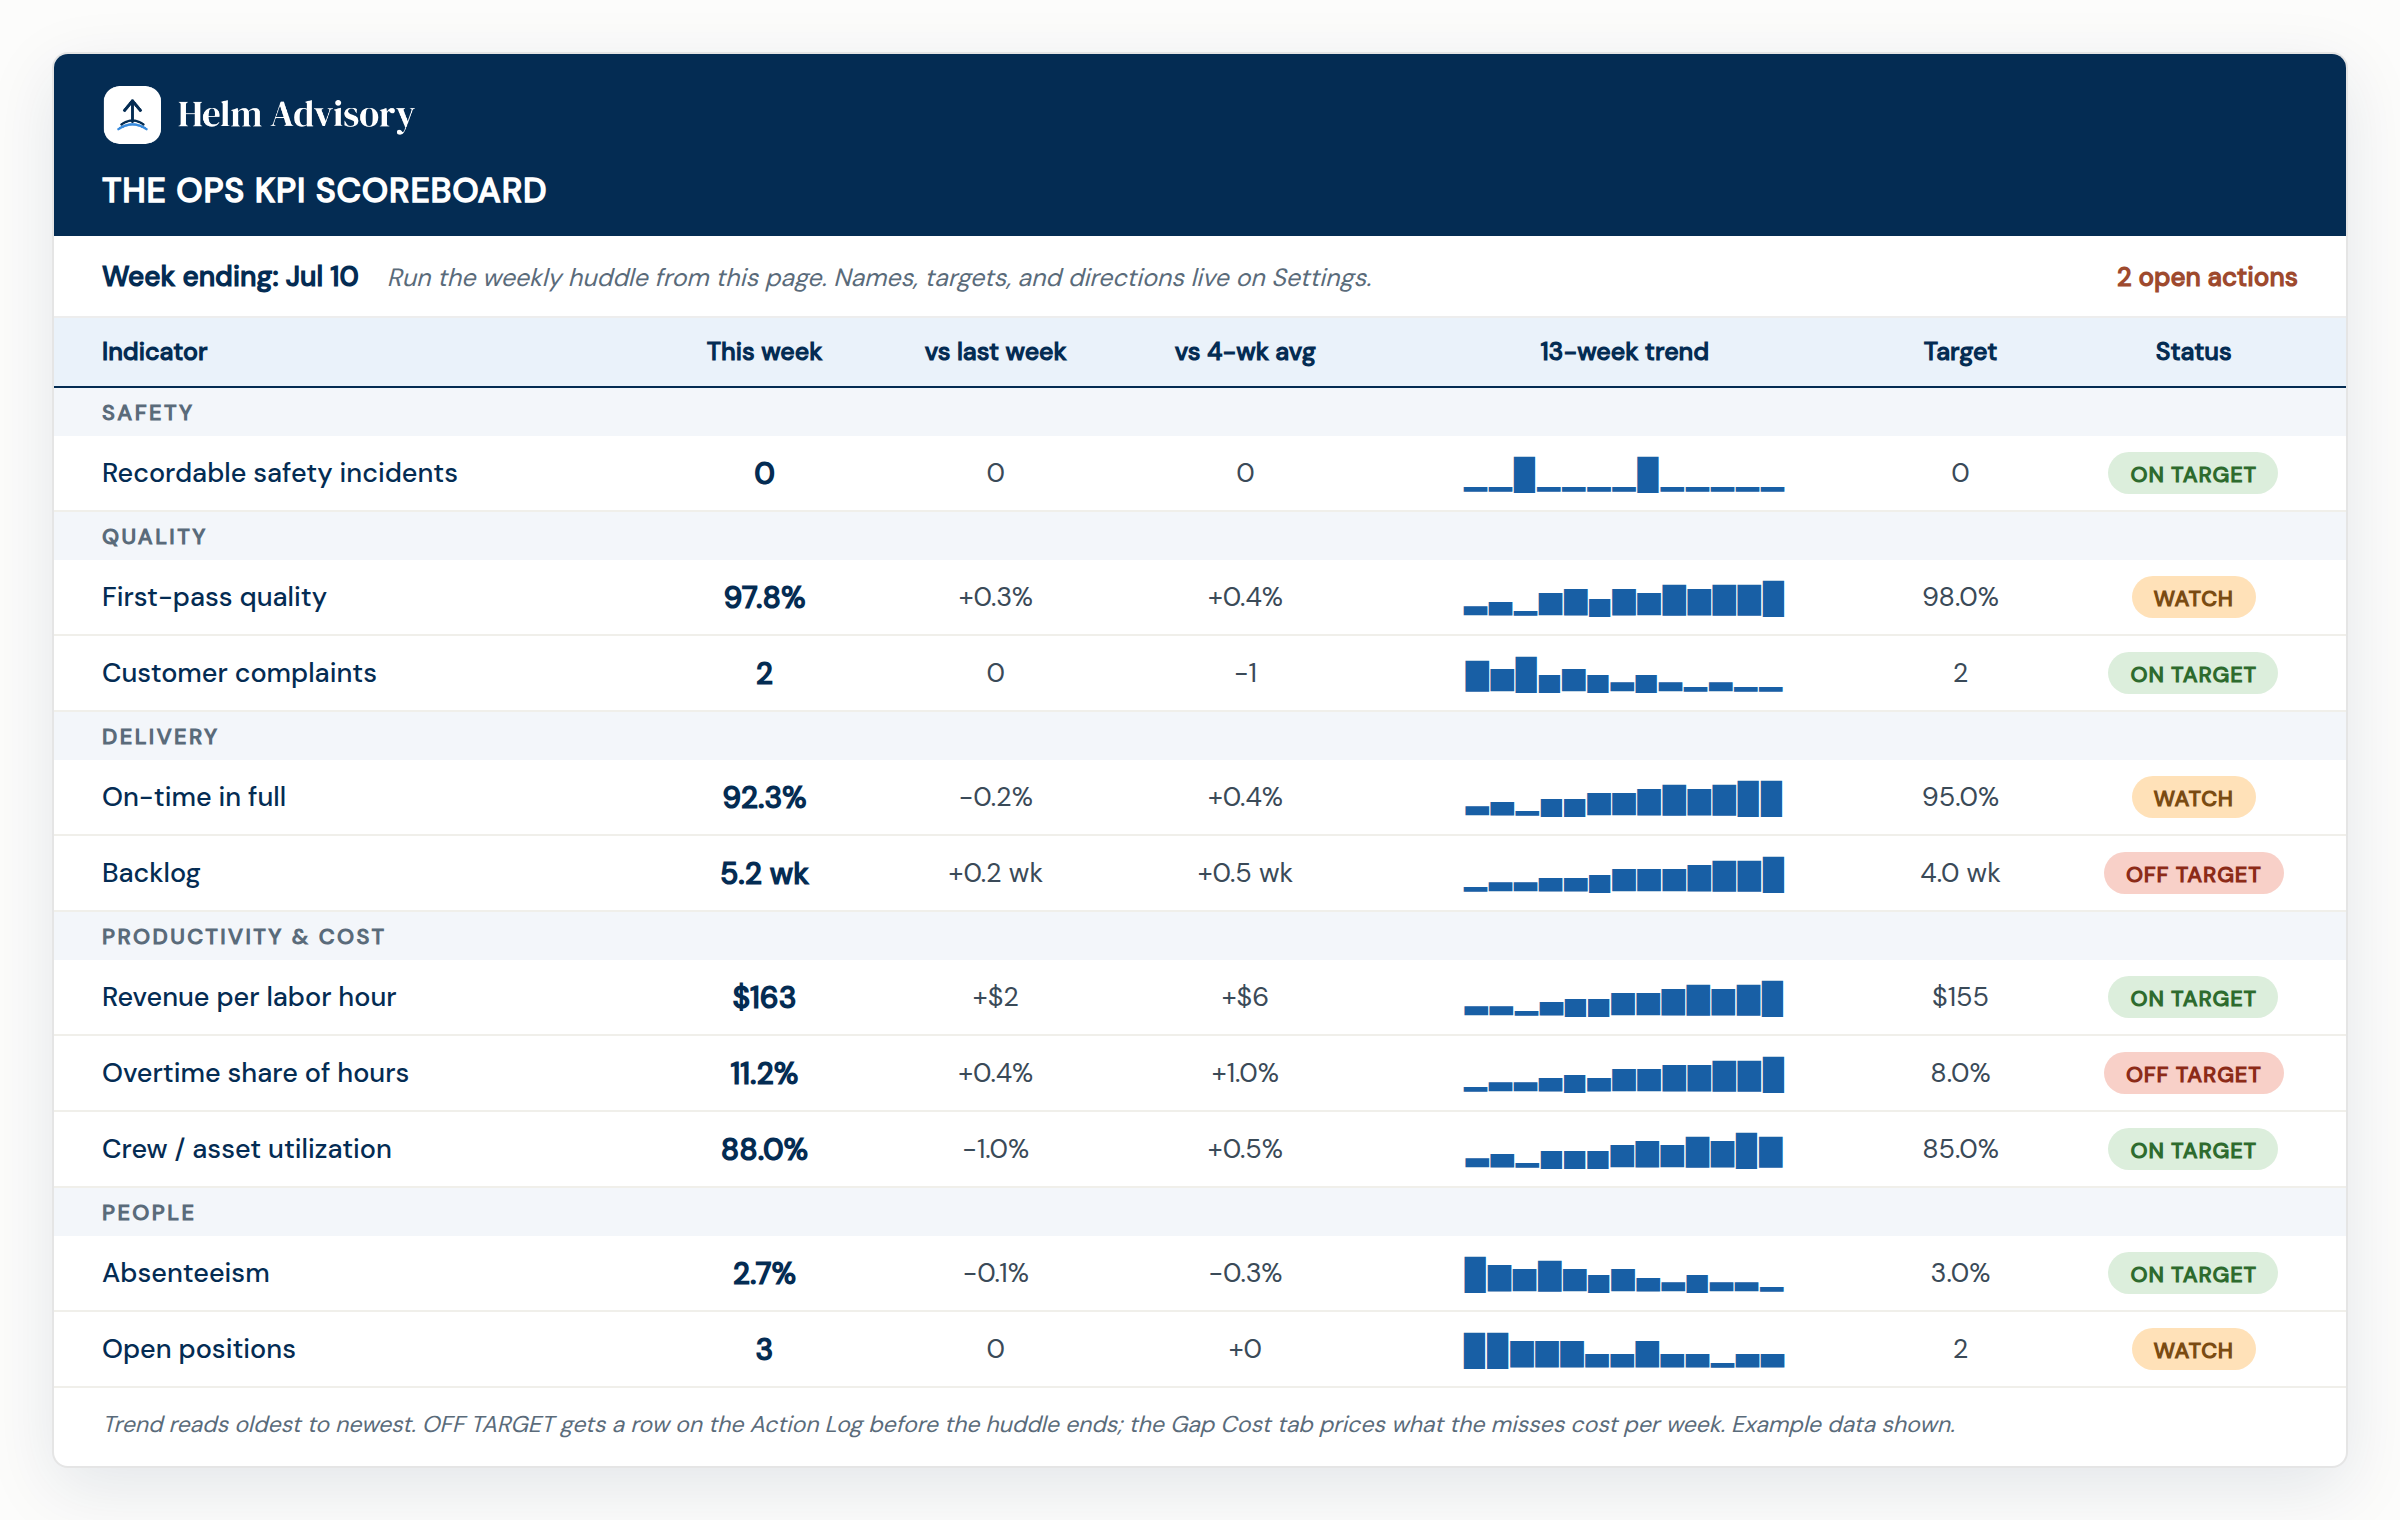
Most operations meetings run on memory and the loudest voice in the room. This scoreboard runs them on ten numbers: safety, quality, delivery, productivity, and people, each with its trend, its target, and a traffic light that decides what gets discussed.
What's inside
- Ten weekly KPIs on the SQDCP standard: safety, quality, delivery, productivity and cost, people, each with trend, target, and a traffic light that obeys its direction
- A Gap Cost tab that prices every miss in dollars per week and per year. The example data's gaps price out to roughly $816,000 a year
- An Action Log where every red light gets an owner, an action, and a due date; the open-action count sits on the scoreboard
- A Settings tab that retargets everything to your operation: rename the indicators, set targets and directions, name each number's source, and rate your confidence in it
- No macros, no lock-in. Opens in Excel and imports cleanly into Google Sheets
Get the workbook
We only use this to send the workbook and occasional operator notes. Unsubscribe anytime.
Done. Your download is ready:
Download the workbook (Excel)How to use it
- Spend 30 minutes on the Settings tab first. Rename the indicators to how your operation talks: revenue per route-hour for a fleet, wrench time for a service shop, units per line-hour for a plant. Then put a dollar figure on each miss and name where each number comes from.
- Enter ten numbers each week on the Weekly Data tab. Most teams pull them in under 15 minutes once the sources are named.
- Run the huddle from the Scoreboard. OFF TARGET gets a row on the Action Log, with an owner and a due date, before the meeting ends. WATCH gets a question. Greens get left alone.
- Read Gap Cost once a week, next to its confidence column. The example ships showing why: backlog and overtime red together while on-time delivery stalls is a capacity problem priced at $816K a year, and cutting overtime without fixing throughput would make delivery worse.
The monthly companion is the Owner's Monthly Dashboard, and the money side of the weekly rhythm is the 13-week cash forecast. If you want this scoreboard built around your operation's real drivers, start a conversation.