About this case study. Ironvale is an illustrative composite and its operating data is modeled, because our client work is confidential. The analysis is real: every number on this page is computed from a full lane-level dataset. The pattern is one we see in real regional carriers.
The results, up front
| Measure | Baseline | 12 months later | Change |
|---|---|---|---|
| EBITDA margin | 5.7% | 12.2% | +6.5 points |
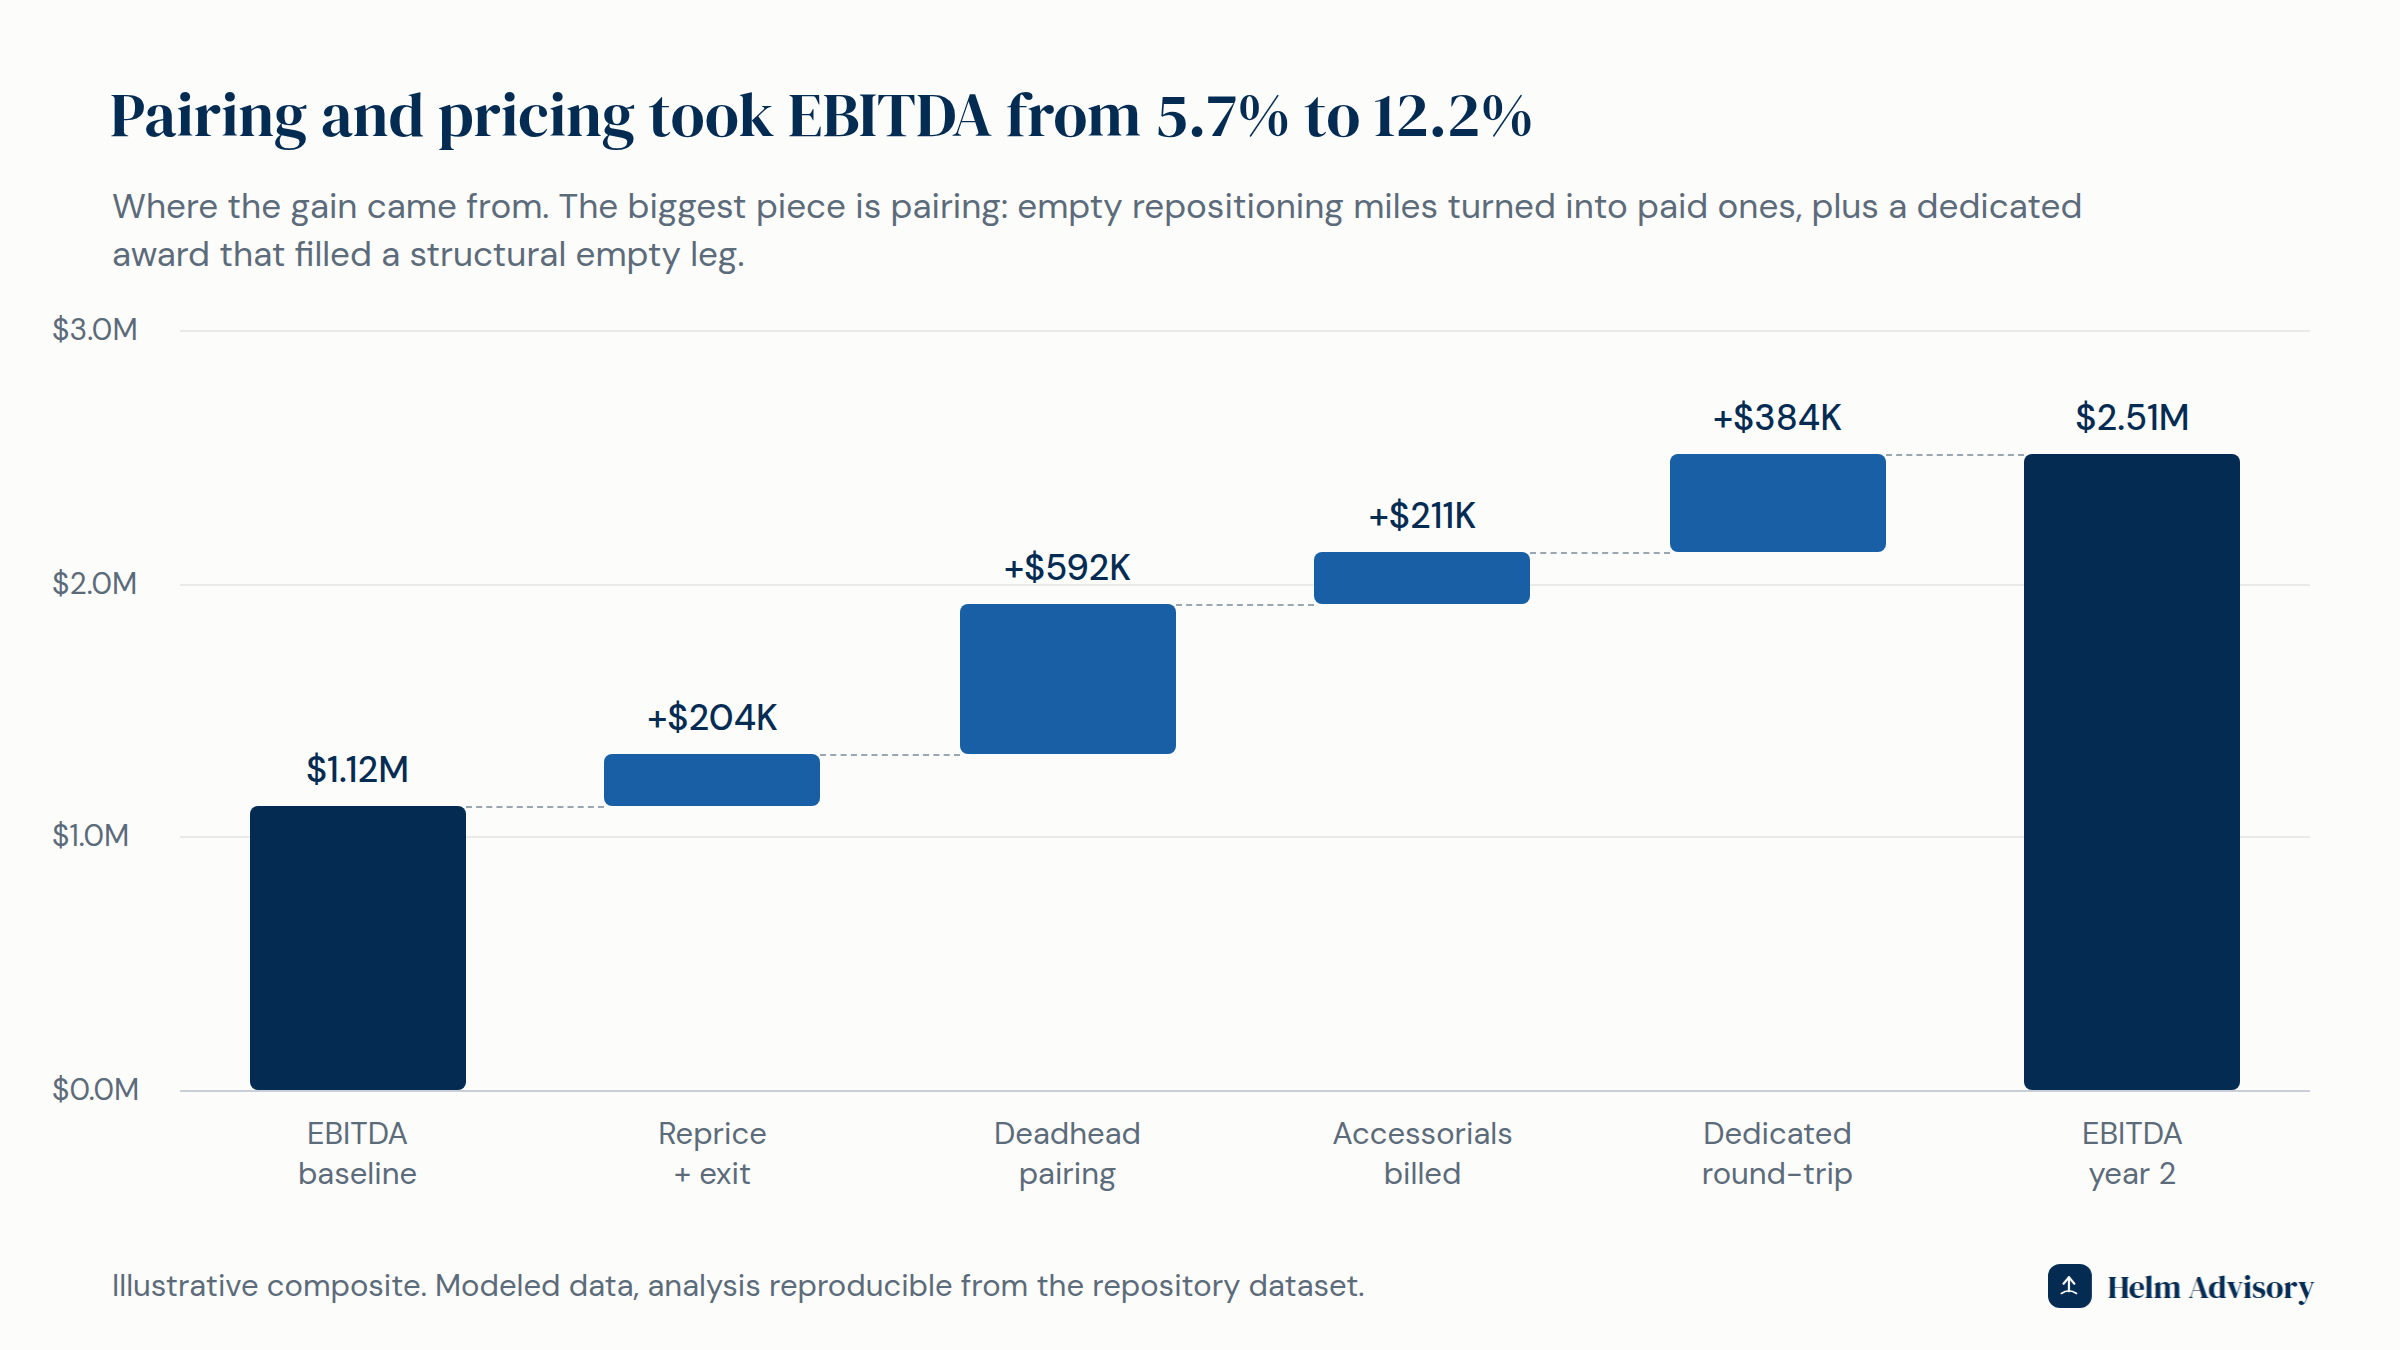
| EBITDA | $1.12M | $2.51M | +$1.39M |
| Deadhead (share of all miles) | 12.8% | 8.1% | 4.7 points fewer empty miles |
| Revenue per total mile | $2.04 | $2.20 | +8% |
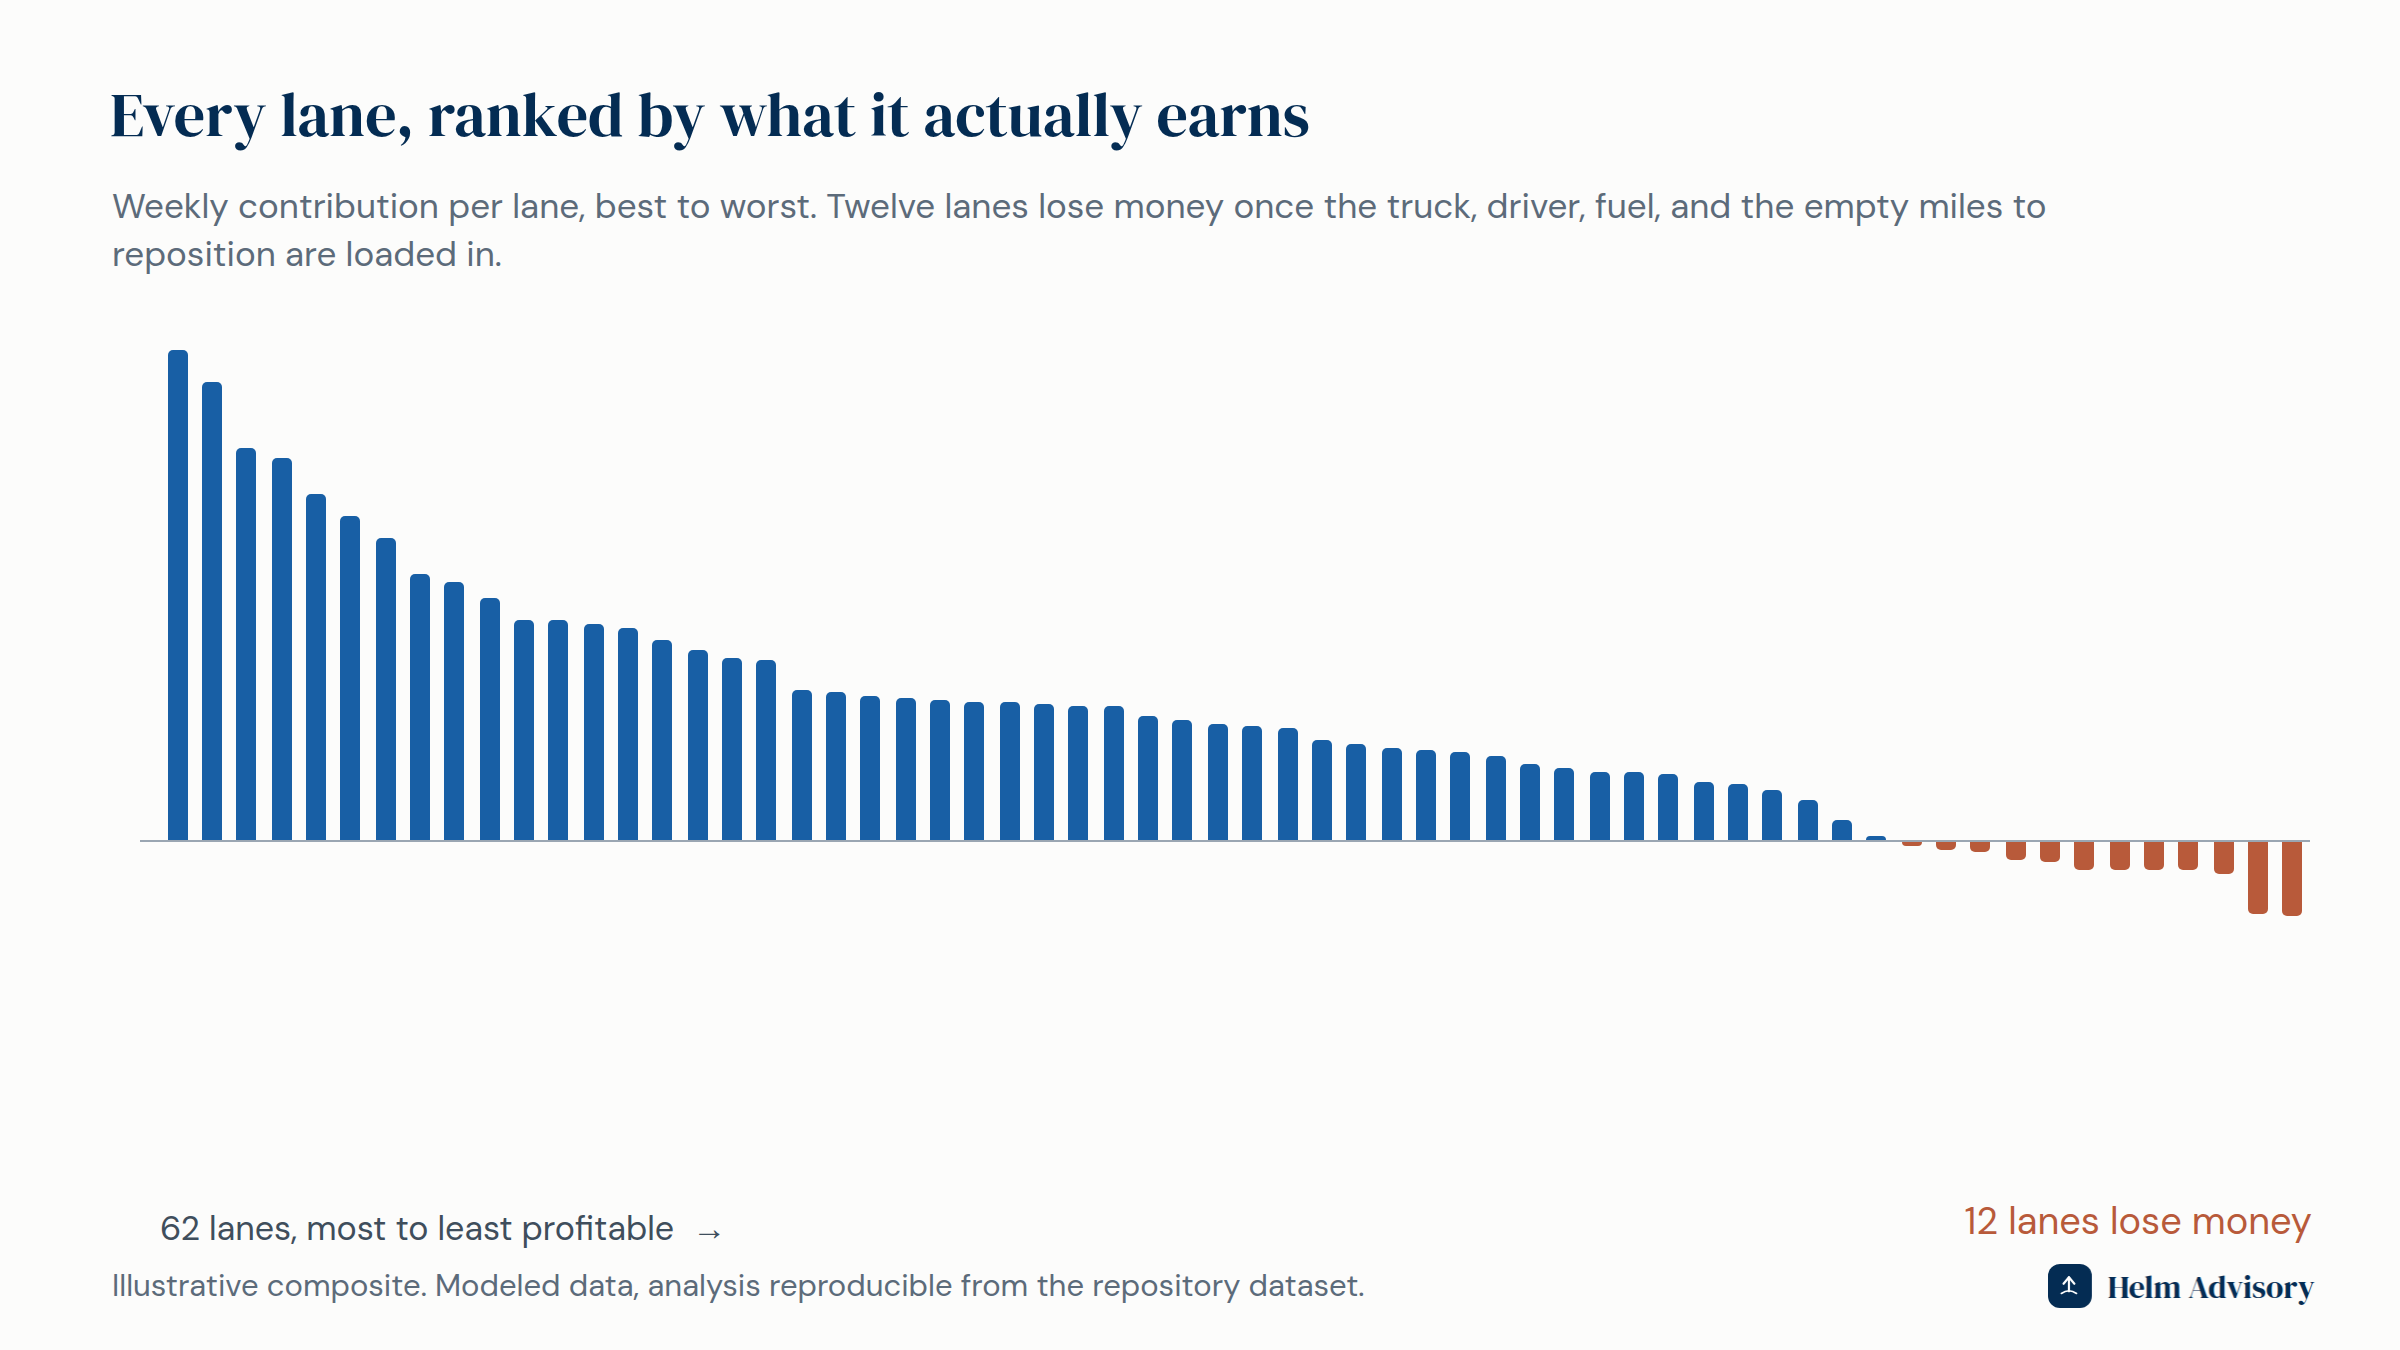
| Money-losing lanes | 12 of 62 | 0 | repriced or handed back |
| Detention and accessorials recovered | n/a | $211K per year | pure margin |
The company
Ironvale is a regional asset-based carrier. About $20M in revenue, 48 trucks, 62 recurring lanes plus spot fill, hauling dry van freight for manufacturers and distributors. Rates were competitive, trucks were full, drivers were busy. EBITDA sat under 6% and had been drifting down for two years.
The symptom
"Our rate per mile is fine. So where does the money go?" The sales report showed healthy rates on every lane. What the sales report did not show was the 60 empty miles the truck ran to get to the next load. The customer pays for the loaded miles. The carrier pays for all of them.
The problem was invisible because nobody was measuring the one number that runs a trucking network: revenue per total mile, empty miles included.
What the data showed
A carrier does not sell miles. It sells loaded miles, and it buys them all. The truck, the driver, the fuel, and the insurance cost the same $1.73 whether the mile earns $2.30 or earns nothing. A lane quoted at a healthy $2.35 per loaded mile that needs a 90-mile empty reposition is not a $2.35 lane. It is a $1.85 lane wearing a good rate.
The idea in plain terms: this is throughput economics at highway speed. A fixed-cost machine, the truck-and-driver day, earns its margin from how many of its miles are paid ones. The quoted rate is only half the equation.
Twelve lanes were losing money. When we built contribution by lane, fully loaded with the truck, the driver, the fuel, and the empty repositioning miles, the same shape appeared that shows up in customer books. A band of well-paired lanes earned steadily. A tail of one-way freight earned nothing, and twelve lanes lost money on every load. Most of that tail was "growth": freight taken to keep trucks busy, priced off the loaded miles alone.
$211K a year of detention sat unbilled. Of 44 contracted customers, nearly half had detention terms, at $65 to $85 an hour after two free hours, that were never invoiced. Drivers waited at docks. The contracts said the waiting was billable. The invoices never went out.
What changed
- Price the whole mile. Every lane got repriced on its true round-trip economics. The underwater tail got a rate that paid for the real miles; about half accepted, and the freight that could not support its geometry was handed back, which freed trucks rather than losing them.
- Pair the backhauls. We mapped the network and matched one-way lanes into round trips, using the freed capacity to chase freight that filled existing empty legs instead of creating new ones. Network deadhead fell from 12.8% of miles to 8.1%.
- Bill the waiting. Detention and accessorial billing got an owner, a trigger in dispatch, and a weekly audit. $211K a year recovered on terms customers had already signed.
- One dedicated round-trip. We pursued and won a dedicated contract that ran loaded both directions along a corridor the network already served. $1.6M of revenue that arrived at unusually high margin, because the return leg was already paid for.
What happened
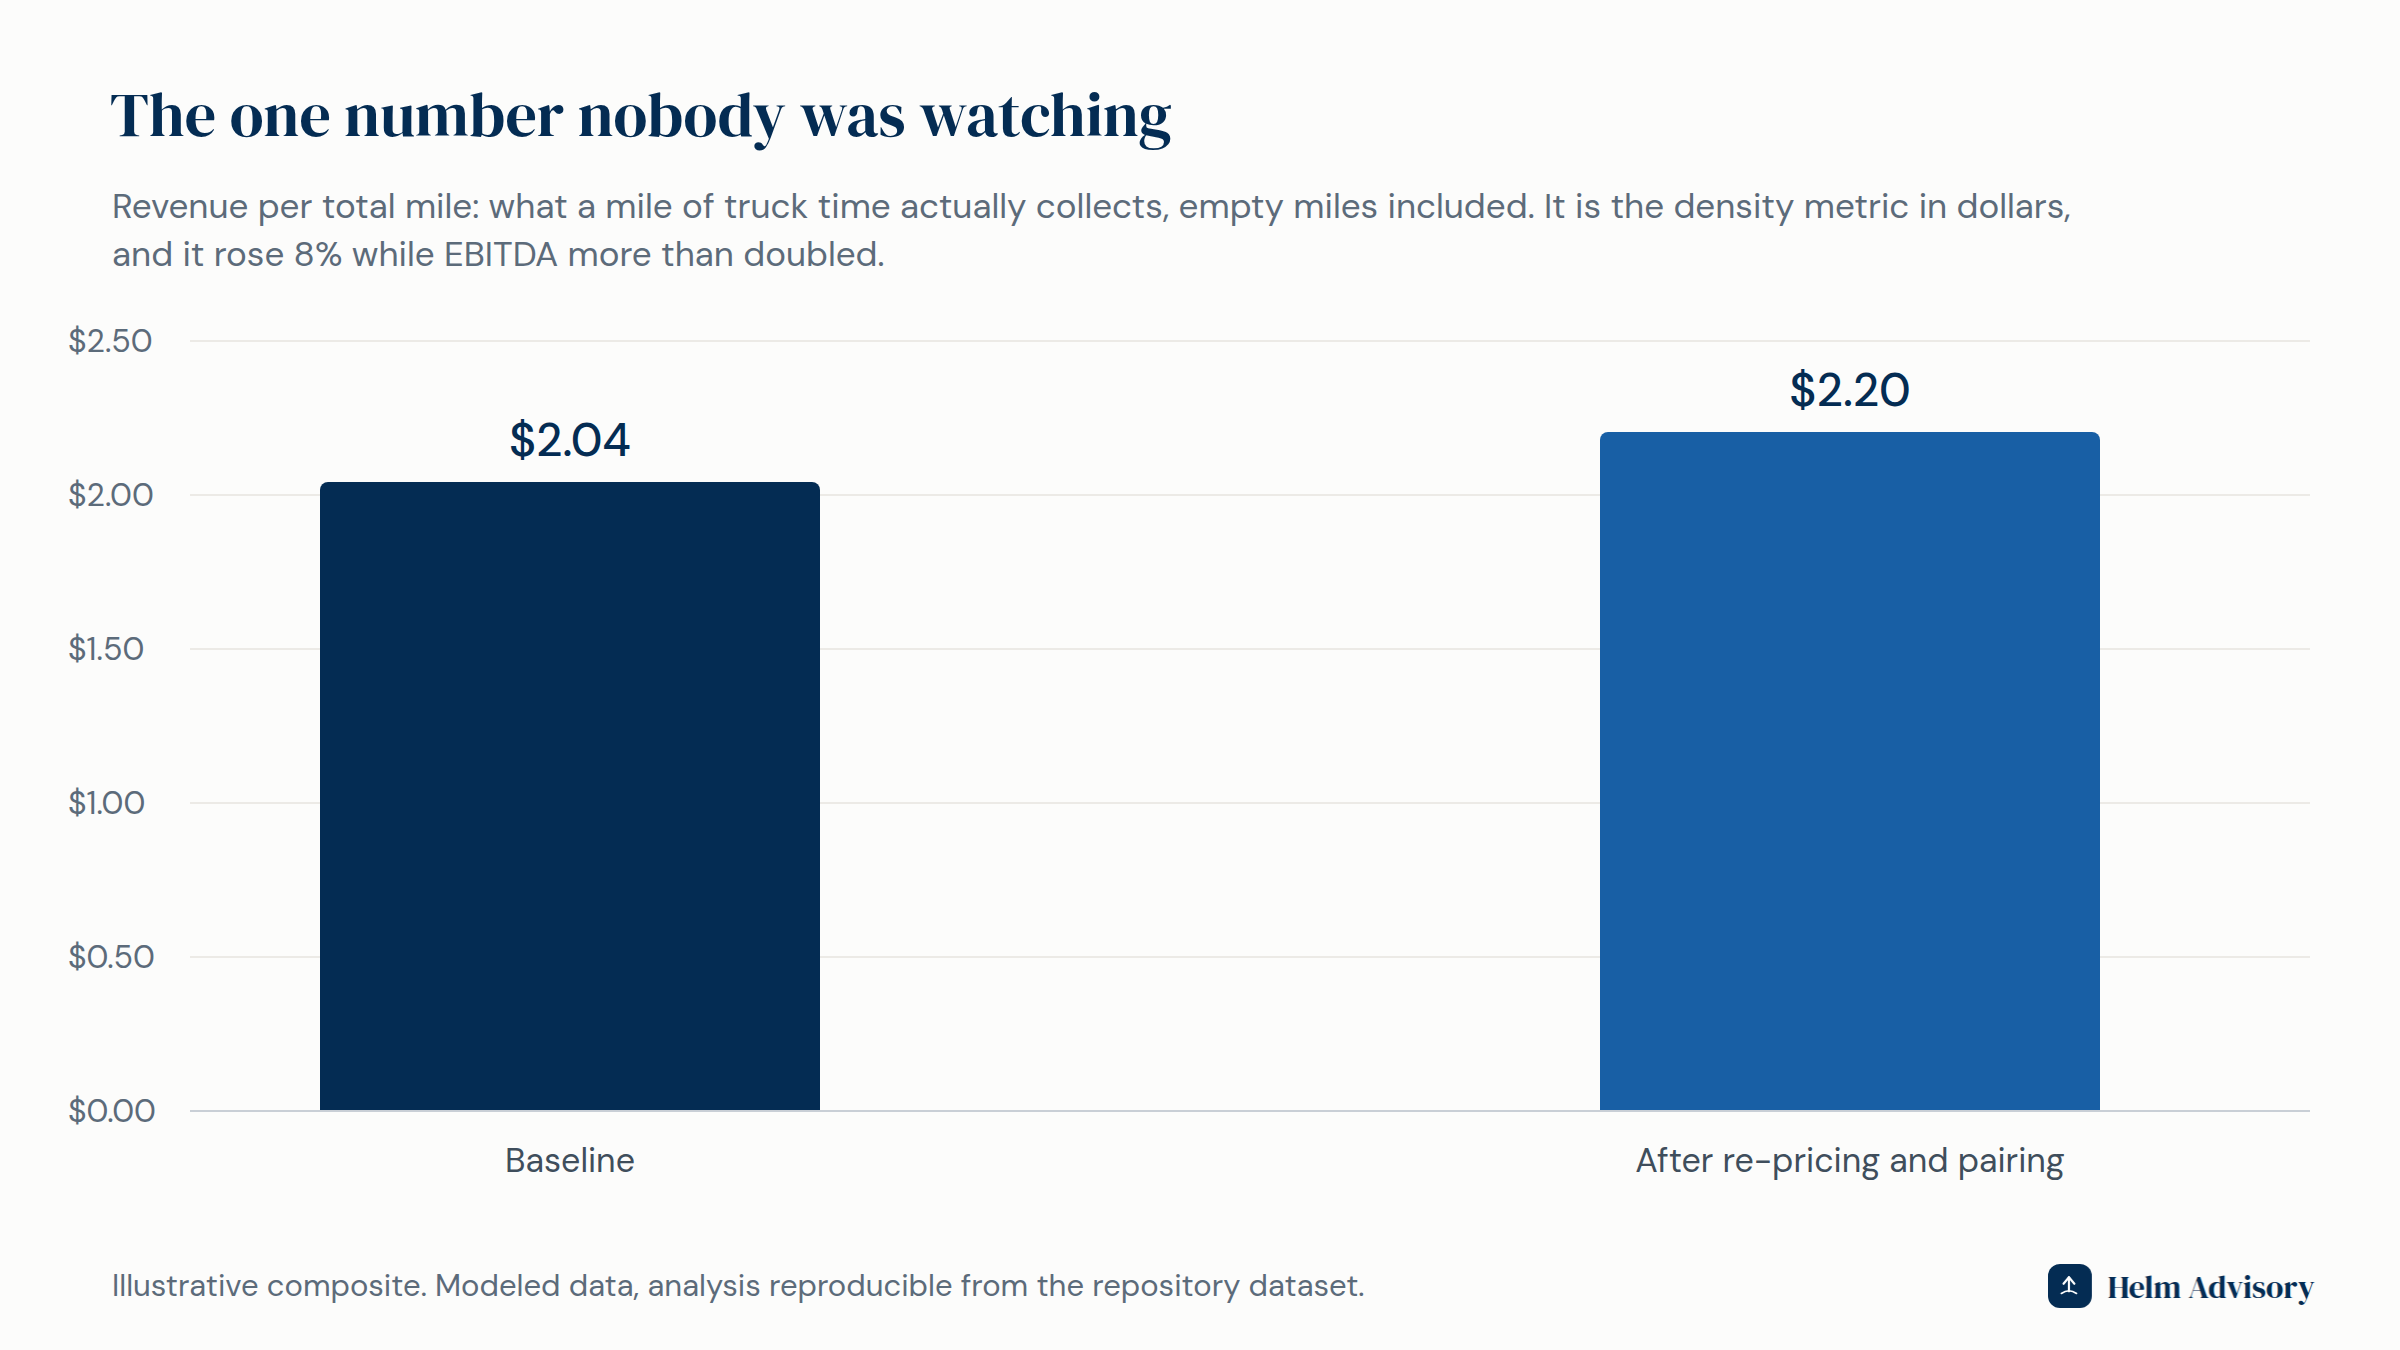
Revenue per total mile rose from $2.04 to $2.20 with the same 48 trucks. EBITDA went from $1.12M to $2.51M, 5.7% to 12.2% of revenue. No new equipment, no new terminals. The network just stopped paying to drive empty.
The exit angle
Freight businesses are bought on network quality: paired lanes, dedicated contracts, and accessorial discipline are what a buyer's diligence team calls durable margin. A carrier earning $2.20 per total mile with clean detention billing is worth materially more than one earning $2.04 with a book of one-way freight, even at the same revenue. The operating work and the value work are the same work, and it plugs directly into how we serve logistics operators.
Curious what your own lanes actually earn? Start a conversation, or take the two-minute Exit-Readiness Scorecard.
Methodology: modeled lane-level data (loads, loaded and empty miles, rates, and fully loaded cost per mile) plus 44 customer contracts with detention terms. All figures computed from the dataset; the EBITDA bridge reconciles. Composite prepared so the mechanics can be shown with a specificity confidential client work does not allow.