About this case study. Cardinal is an illustrative composite and its operating data is modeled, because our client work is confidential. The analysis is real: every number on this page is computed from a full dataset of technician hours and service agreements. The pattern is one we see in real field-services businesses.
The results, up front
| Measure | Baseline | 12 months later | Change |
|---|---|---|---|
| Billable utilization (wrench time) | 60% | 68% | +8 points |
| EBITDA margin | 10.2% | 16.4% | +6.2 points |
| EBITDA | $2.71M | $4.69M | +$1.98M |
| Underwater service agreements | 36 of 130 | repriced or released | n/a |
The company
Cardinal is a commercial HVAC and mechanical contractor. About $27M in revenue, 62 field technicians, a mix of project work and service agreements. Revenue had grown three years running. Profit had not moved.
The symptom
The owner's frustration was specific: "We're busier than we've ever been and I'm making the same money I made at two-thirds the size." Every crew was booked. The trucks left the yard full. And the EBITDA line was stuck at 10%.
Growth was real. It just was not converting, and the reason was hiding inside the single most important number in a field-services business: how many of the hours you pay for actually reach a customer invoice.
What the data showed
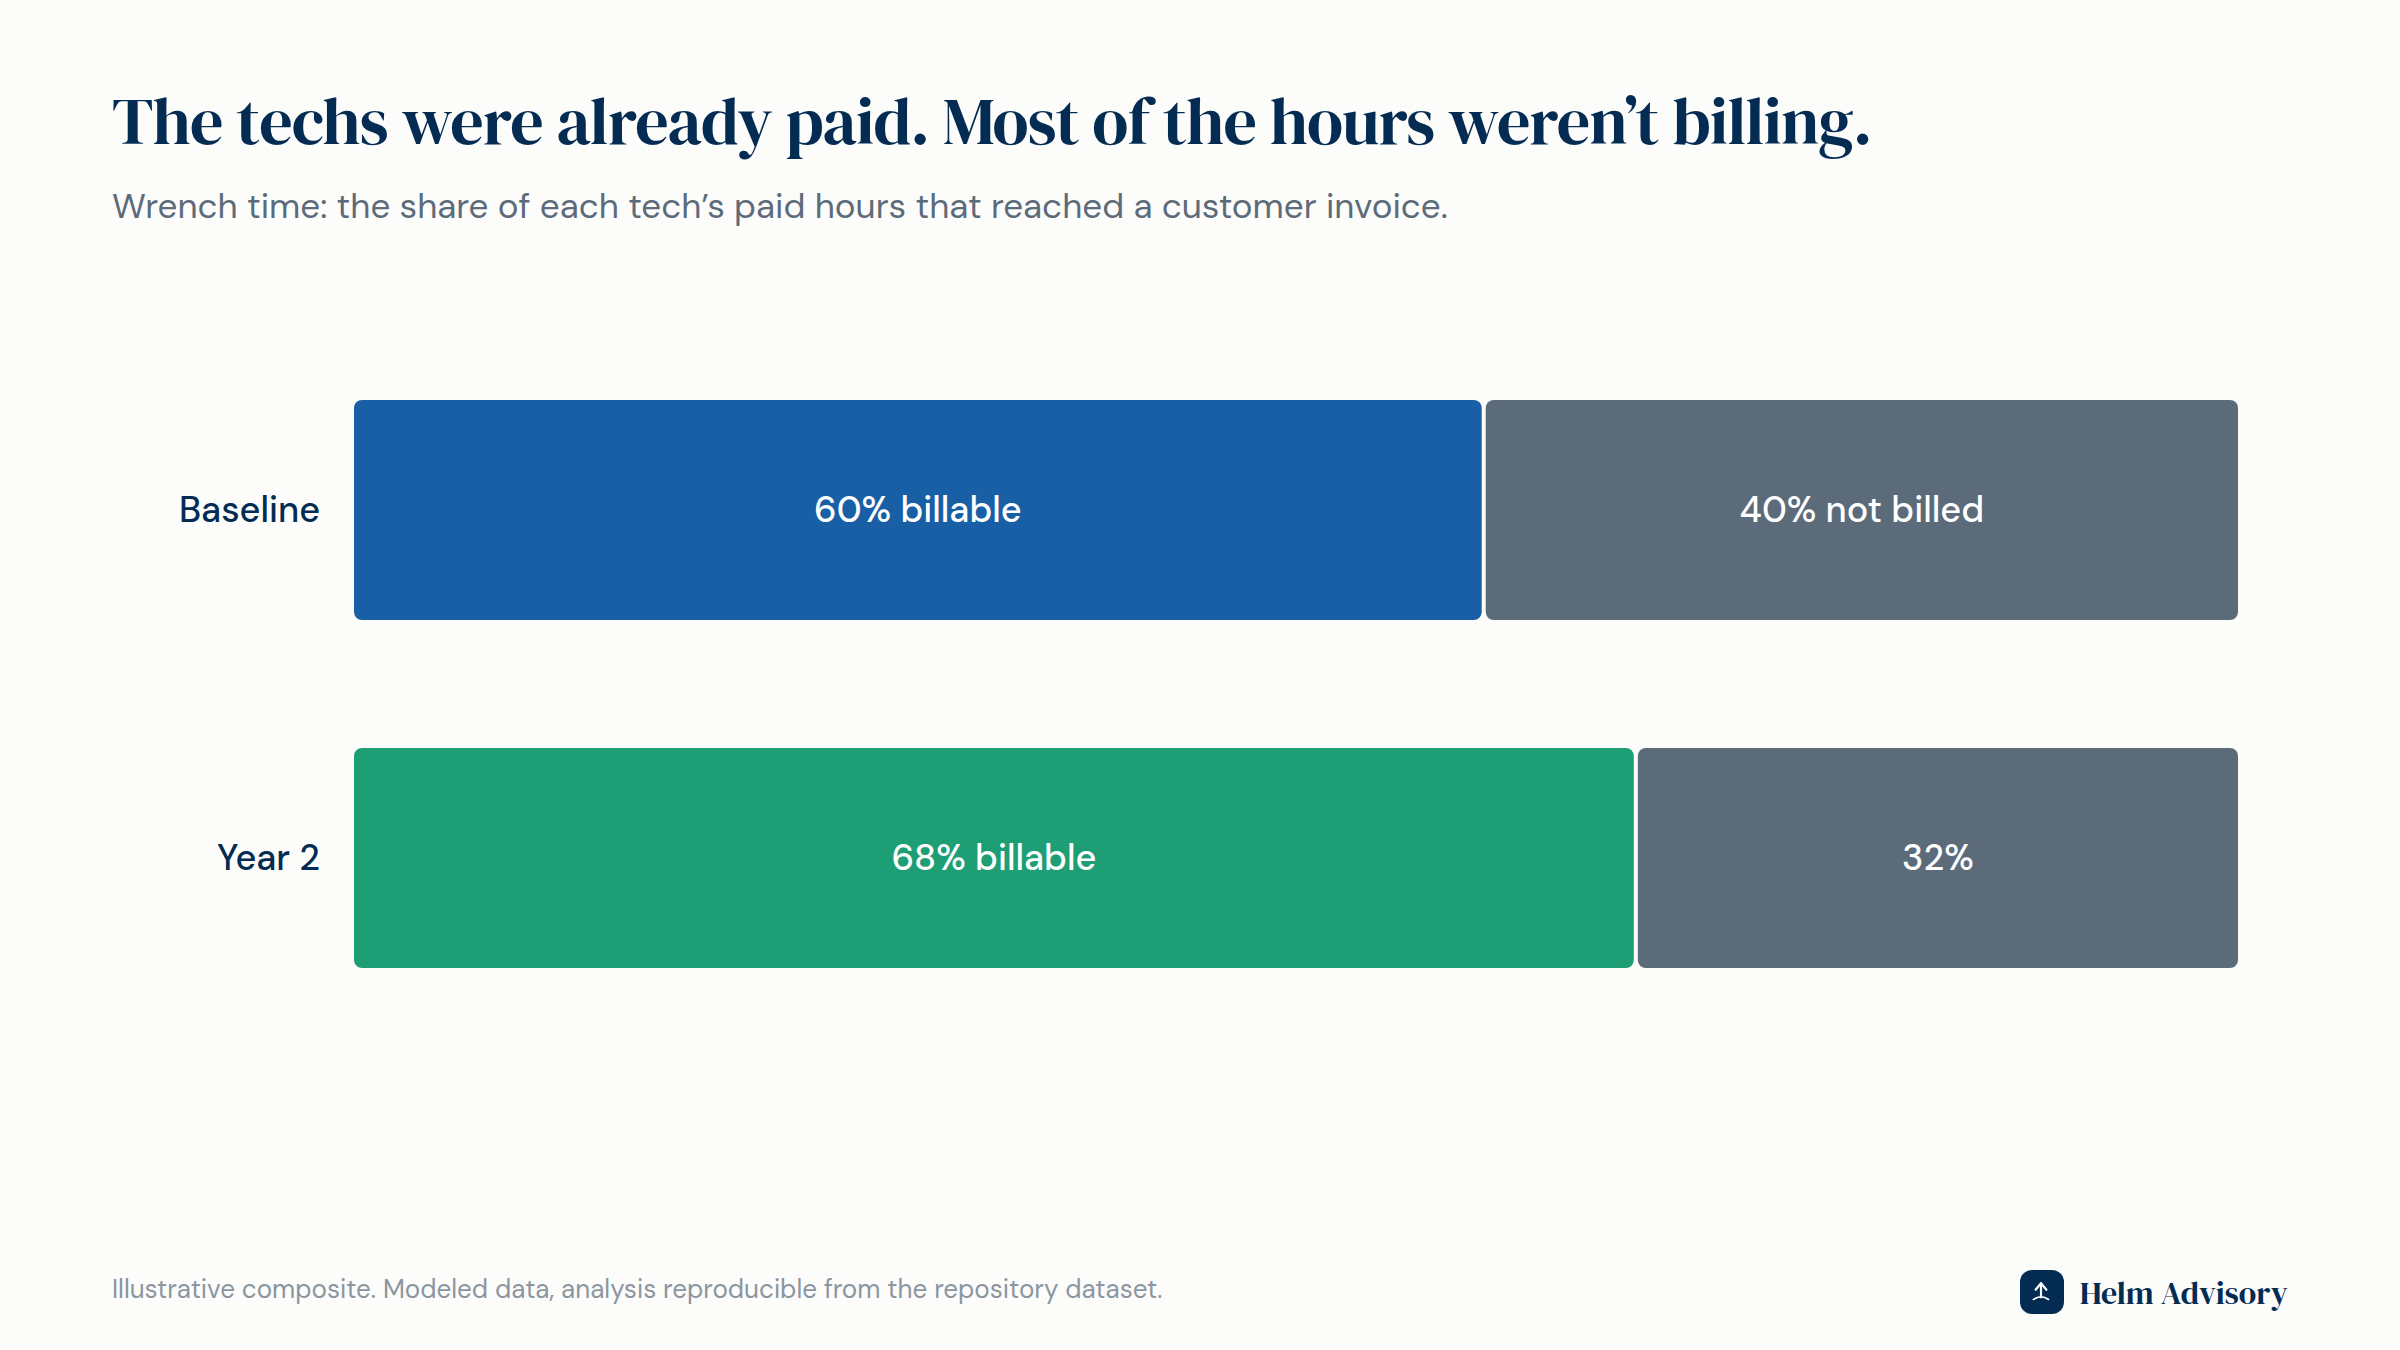
The techs were paid for 2,080 hours a year. Only 60% of them were billing. Wrench time, the industry's word for billable utilization, sat at 60%. The other 40% went to travel, waiting for parts, redoing work, driving back for the tool left at the shop, and gaps between jobs that dispatch never tightened. Every one of those hours was paid and none of it billed.
The idea in plain terms: labor is a fixed cost the day you make payroll, whether the tech bills eight hours or five. So the incremental billable hour is almost pure margin. It bills at the going rate against labor you have already paid for. Raising utilization is the highest-leverage move in the business, and almost nobody measures it honestly.
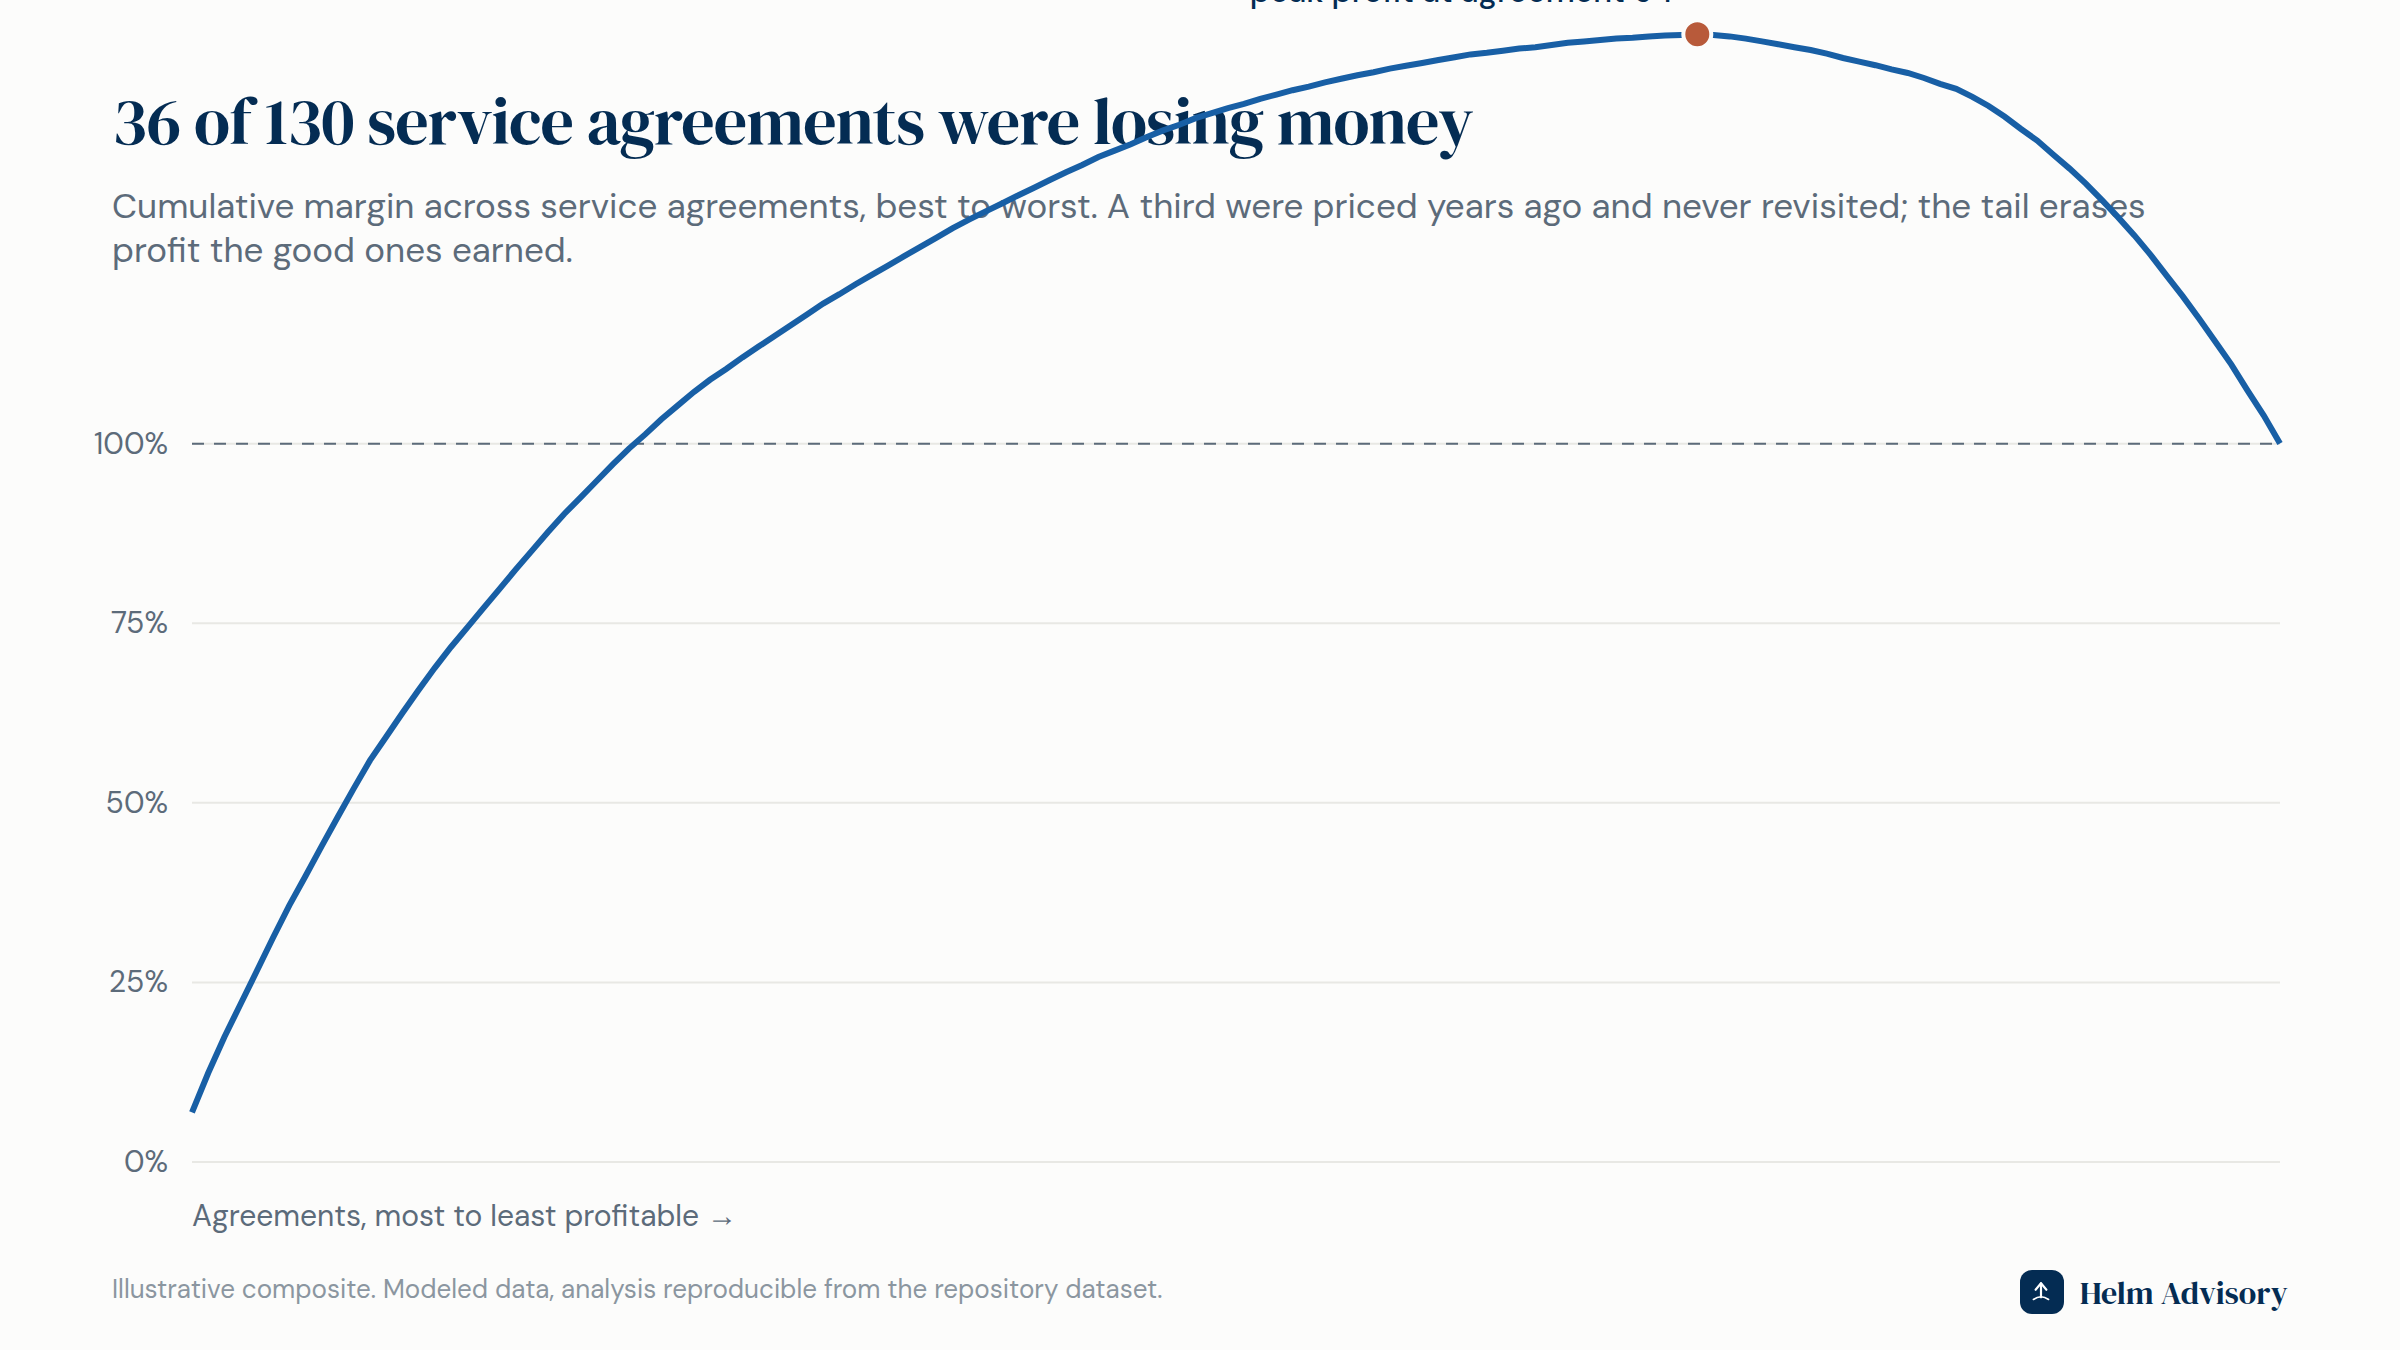
36 of 130 service agreements were losing money. Priced years ago and never revisited, a third of the maintenance agreements cost more to serve than they collected. The blended number looked fine; the tail erased the profit the good agreements earned.
Time-and-materials work was leaking. Small parts, after-hours premiums, and travel that was billable by contract but never captured on the ticket. A point and a half of revenue, walking out on incomplete paperwork.
What changed
- Dispatch discipline. The schedule got built around minimizing windshield time and dead gaps: parts staged before the truck rolled, jobs sequenced by geography, a daily look at every tech under 6 billable hours. Utilization moved from 60% to 68%. On 62 techs, that is roughly 13,000 more billable hours a year, billing against labor already on the books.
- Reprice the agreements. The underwater agreements got a fair increase tied to the real cost to serve. The few that could not work were released.
- Capture the T&M leakage. Ticket discipline so the billable travel, parts, and after-hours actually reached the invoice.
What happened
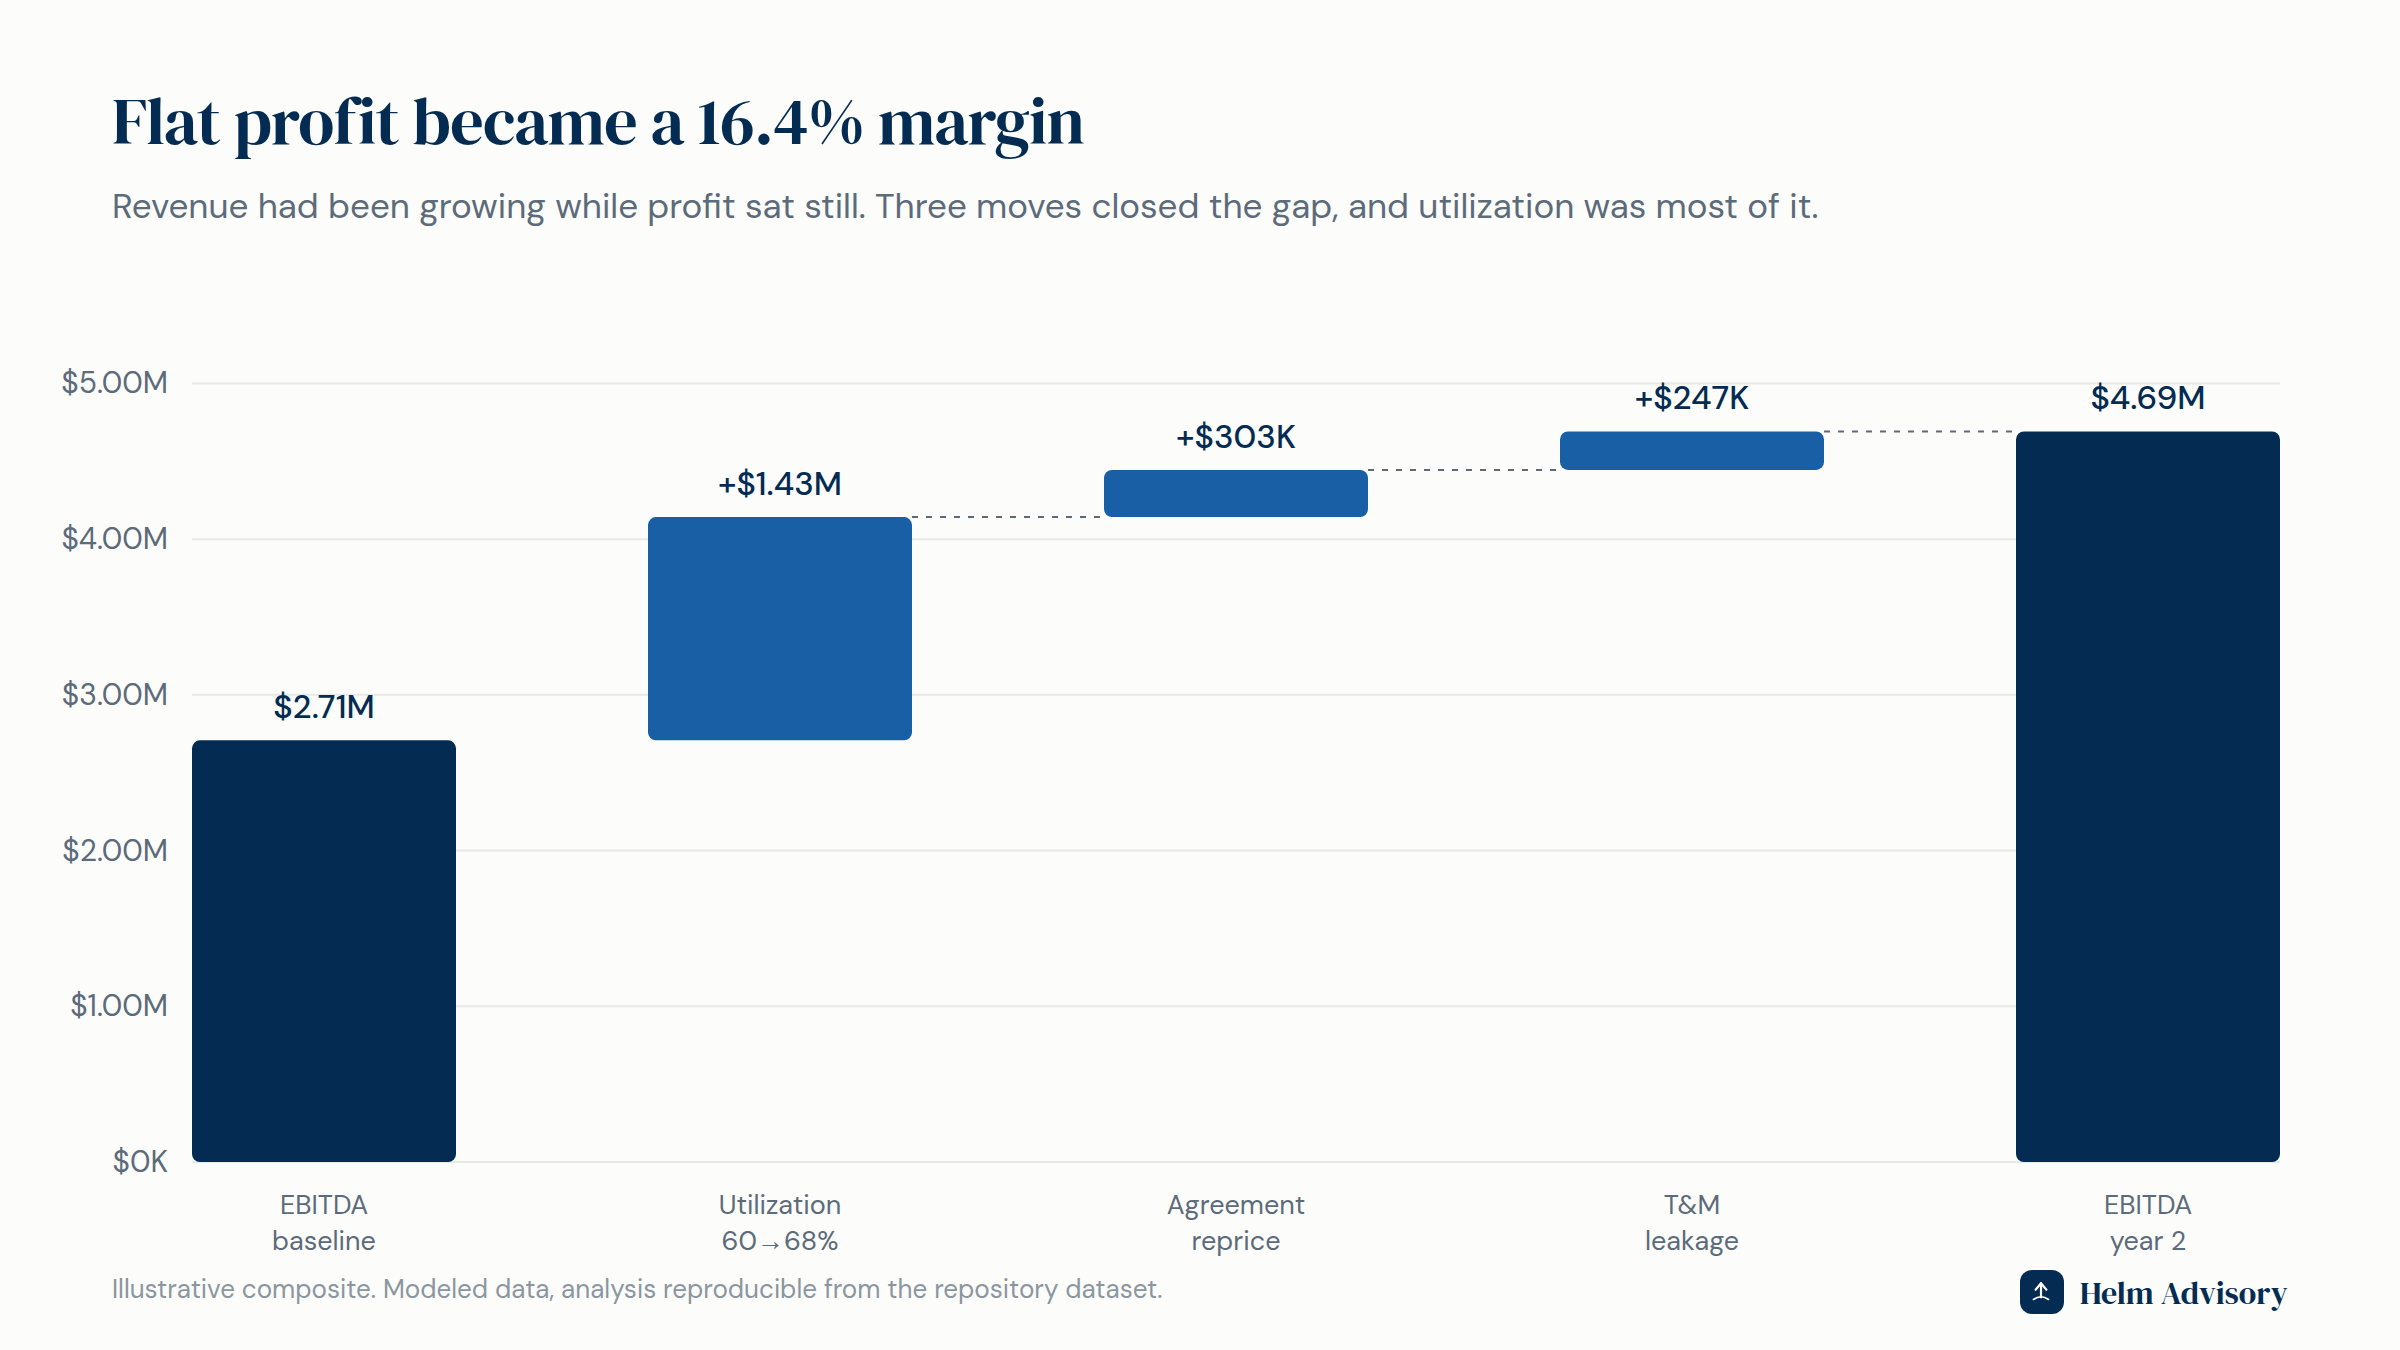
EBITDA went from $2.71M to $4.69M, a 10.2% margin to 16.4%. The company did not sell more work or hire more people. It collected on the work and the people it already had. Utilization alone was $1.4M of the swing.
The exit angle
Buyers of field-services businesses look hard at technician utilization and the quality of the service book, because recurring, profitable maintenance revenue is what they are really buying. A contractor at 68% wrench time with a clean, fairly priced agreement base is worth a different multiple than one at 60% with a third of its agreements underwater. The work that fixes the profit is the same work that lifts the enterprise value.
If you run a field-services business and profit is not keeping pace with revenue, that gap usually has a number. Start a conversation, or read how we think about the operations seat.
Methodology: modeled data covering 62 technicians (paid vs billable hours) and 130 service agreements with cost-to-serve. All figures computed from the dataset; the EBITDA bridge reconciles. Composite prepared so the mechanics can be shown with a specificity confidential client work does not allow.