About this case study. Redhawk is an illustrative composite and its operating data is modeled, because our client work is confidential. The analysis is real: every number on this page is computed from a full route-level dataset. The pattern is one we see in real haulers.
The results, up front
| Measure | Baseline | 12 months later | Change |
|---|---|---|---|
| EBITDA margin | 6.4% | 15.9% | +9.5 points |
| Revenue per route-hour | $293 | $380 | +30% |
| Routes | 24 | 21 | 3 consolidated |
| Money-losing routes | 4 of 24 | 0 | repriced or absorbed |
| Contract escalators recovered | — | $177K per year | pure margin |
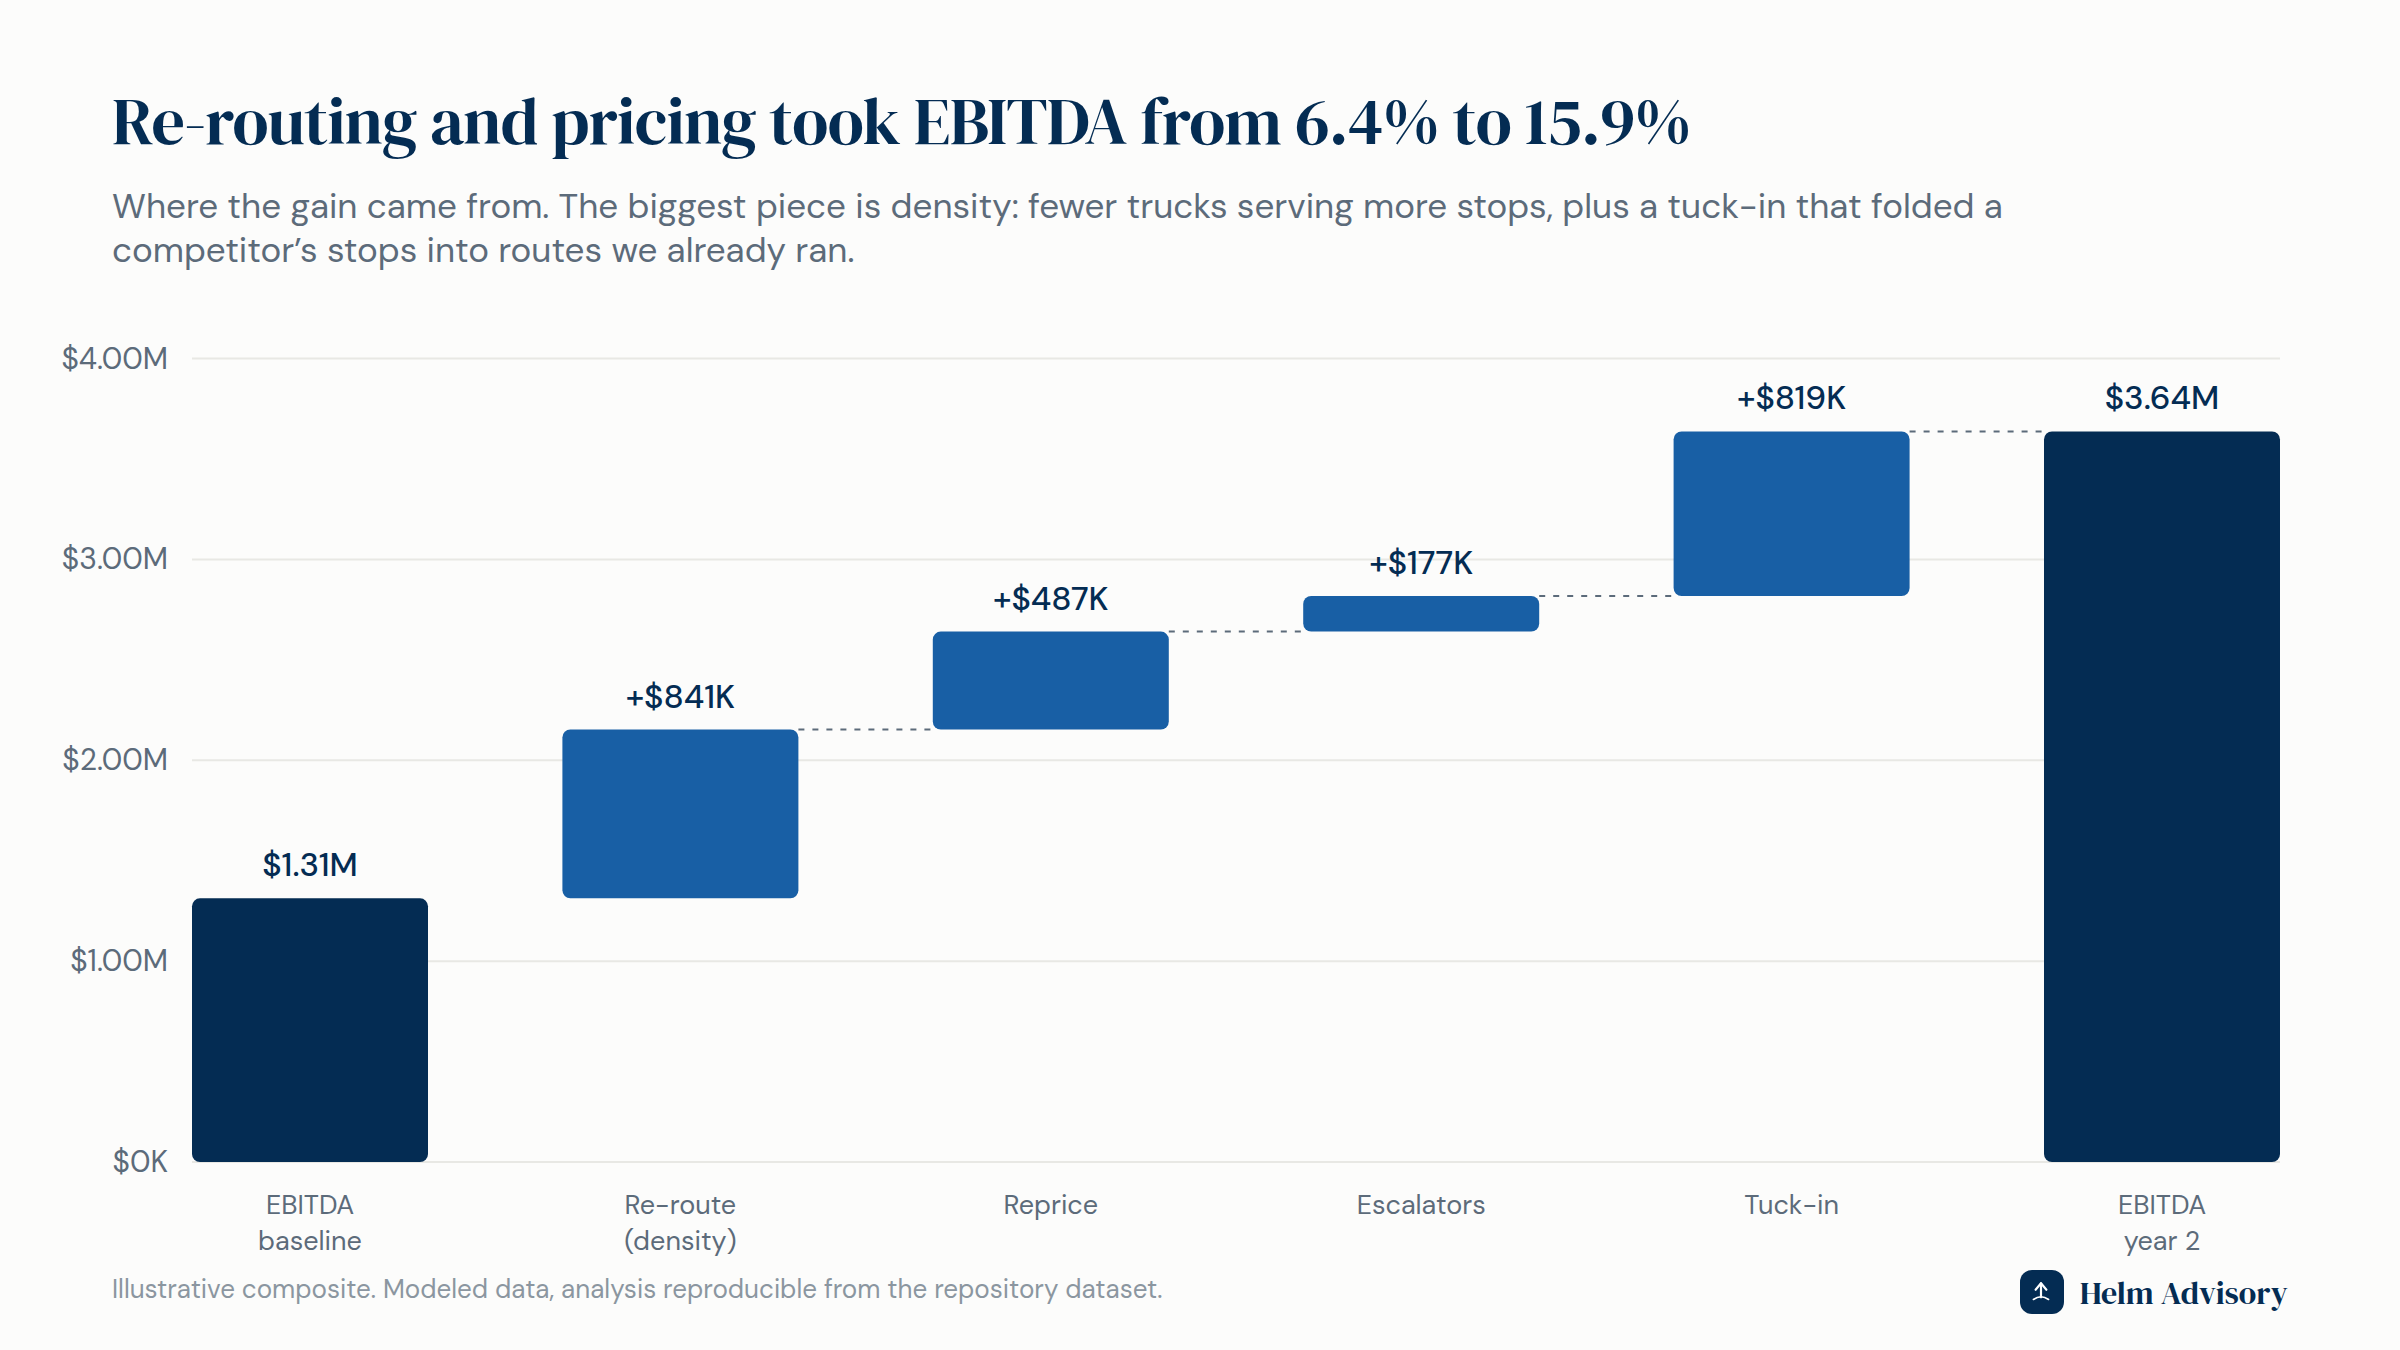
| EBITDA | $1.31M | $3.64M | +$2.33M |
The company
Redhawk is a regional residential and commercial waste hauler. About $20M in revenue, 24 routes, a mix of subscription residential and contracted commercial. Growing every year, and the owner could not understand why the growth was not showing up in profit.
The symptom
"We keep winning business and the margin keeps getting worse." Every new commercial account looked like a win in the sales report. The trucks were busy. The routes were full. And EBITDA had drifted from the low teens down toward 6%.
The problem was invisible because nobody was measuring the one number that runs a hauling business: revenue per route-hour.
What the data showed
A hauler does not sell hauling. It sells the minutes between stops. The truck, the driver, the fuel, and the insurance get paid whether the next stop is 400 feet away or four miles away. Dense routes spread that fixed hour across 80 stops. Sparse routes spread it across 30. Same cost, wildly different revenue per hour.
The idea in plain terms: this is throughput economics on wheels. A fixed-cost machine, the truck-and-driver day, earns its margin from how much paying work you push through it. Density is the whole game, and it compounds in both directions.
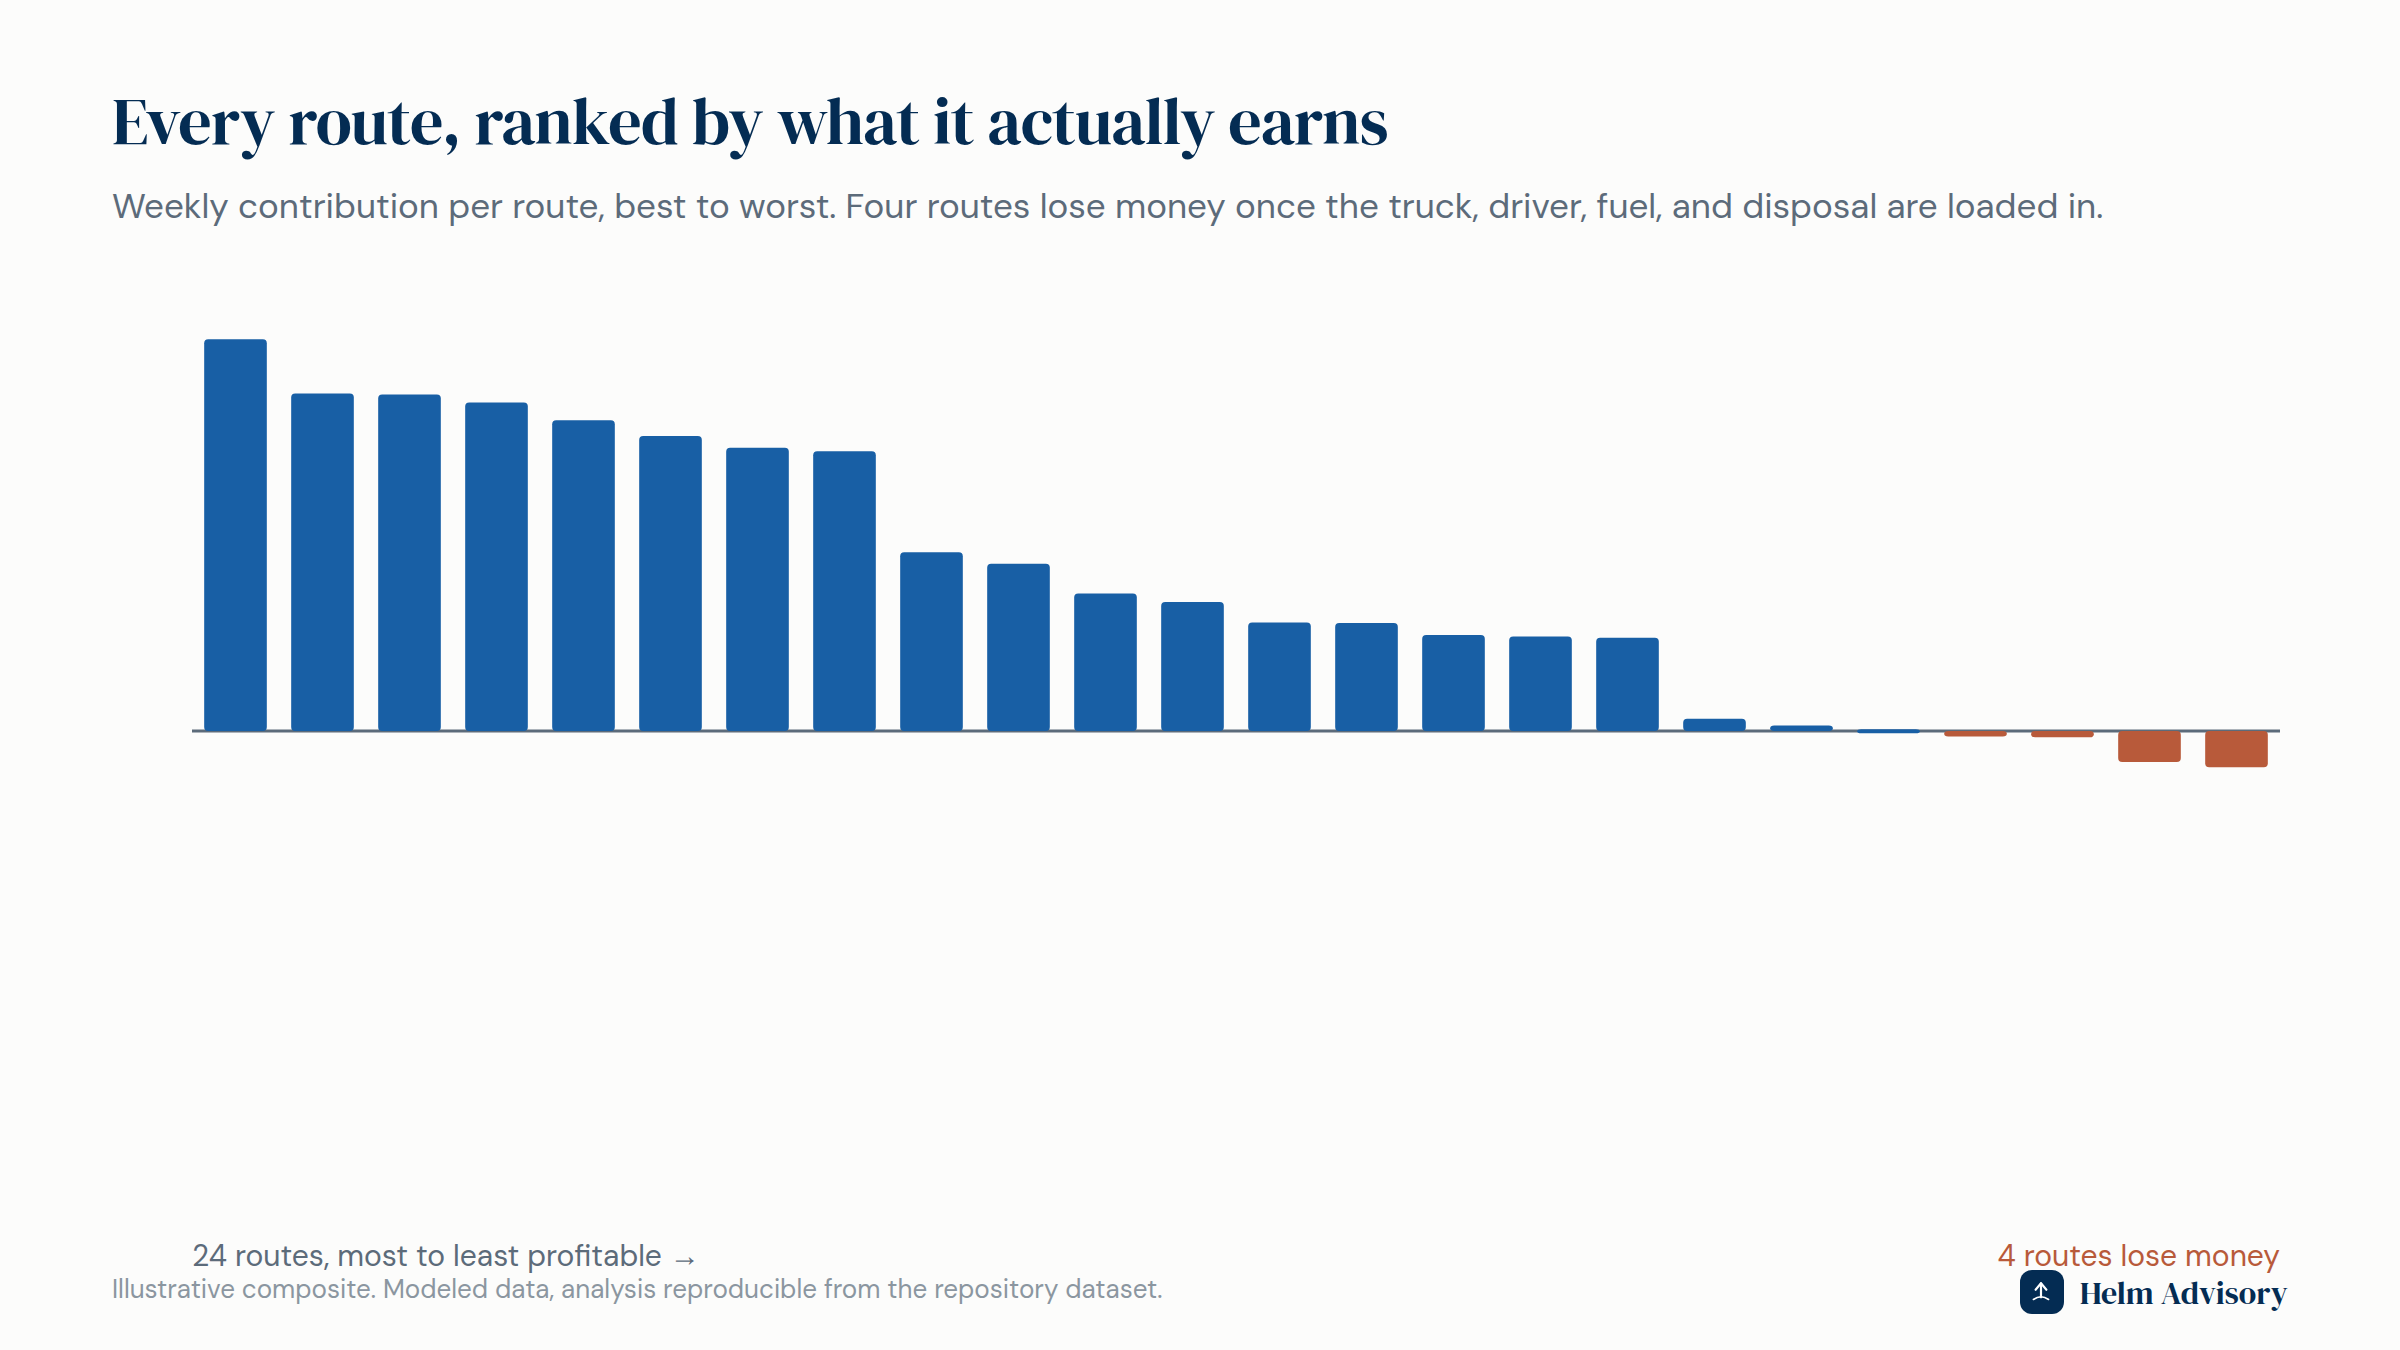
Four routes were losing money. When we built contribution by route, fully loaded with truck, labor, fuel, and disposal, the same shape appeared that shows up in customer books. A band of dense routes earned well. A tail of sparse routes earned nothing, and four lost money outright. Most of that tail was "growth": commercial accounts won over the years that sat off the existing route geography, each one dragging a truck's whole day down.
$177K a year of escalators sat unbilled. Of 40 commercial contracts, nearly half had CPI escalators or fuel surcharges that had never been applied. Money already agreed to, in writing, never invoiced.
What changed
- Re-route for density. We mapped the whole book and rebuilt the routes around geography instead of history. Three of the sparsest routes were consolidated: their trucks came off the road and 92% of their stops folded into neighboring routes at a fraction of the standalone cost. Fewer trucks, more stops each, higher revenue per hour.
- Price the geometry. The off-route and underwater stops got a fair increase tied to the real cost of serving them. A handful that could not support the miles were let go, which freed capacity rather than losing it.
- Bill the contracts. Every escalator and surcharge got an owner and a calendar date. $177K a year recovered with no customer conversation.
- One tuck-in. We bought a competitor's overlapping routes, the classic density play: their stops folded into trucks we already ran, so the acquired revenue arrived at very low incremental cost. Two half-full trucks became one full one.
What happened
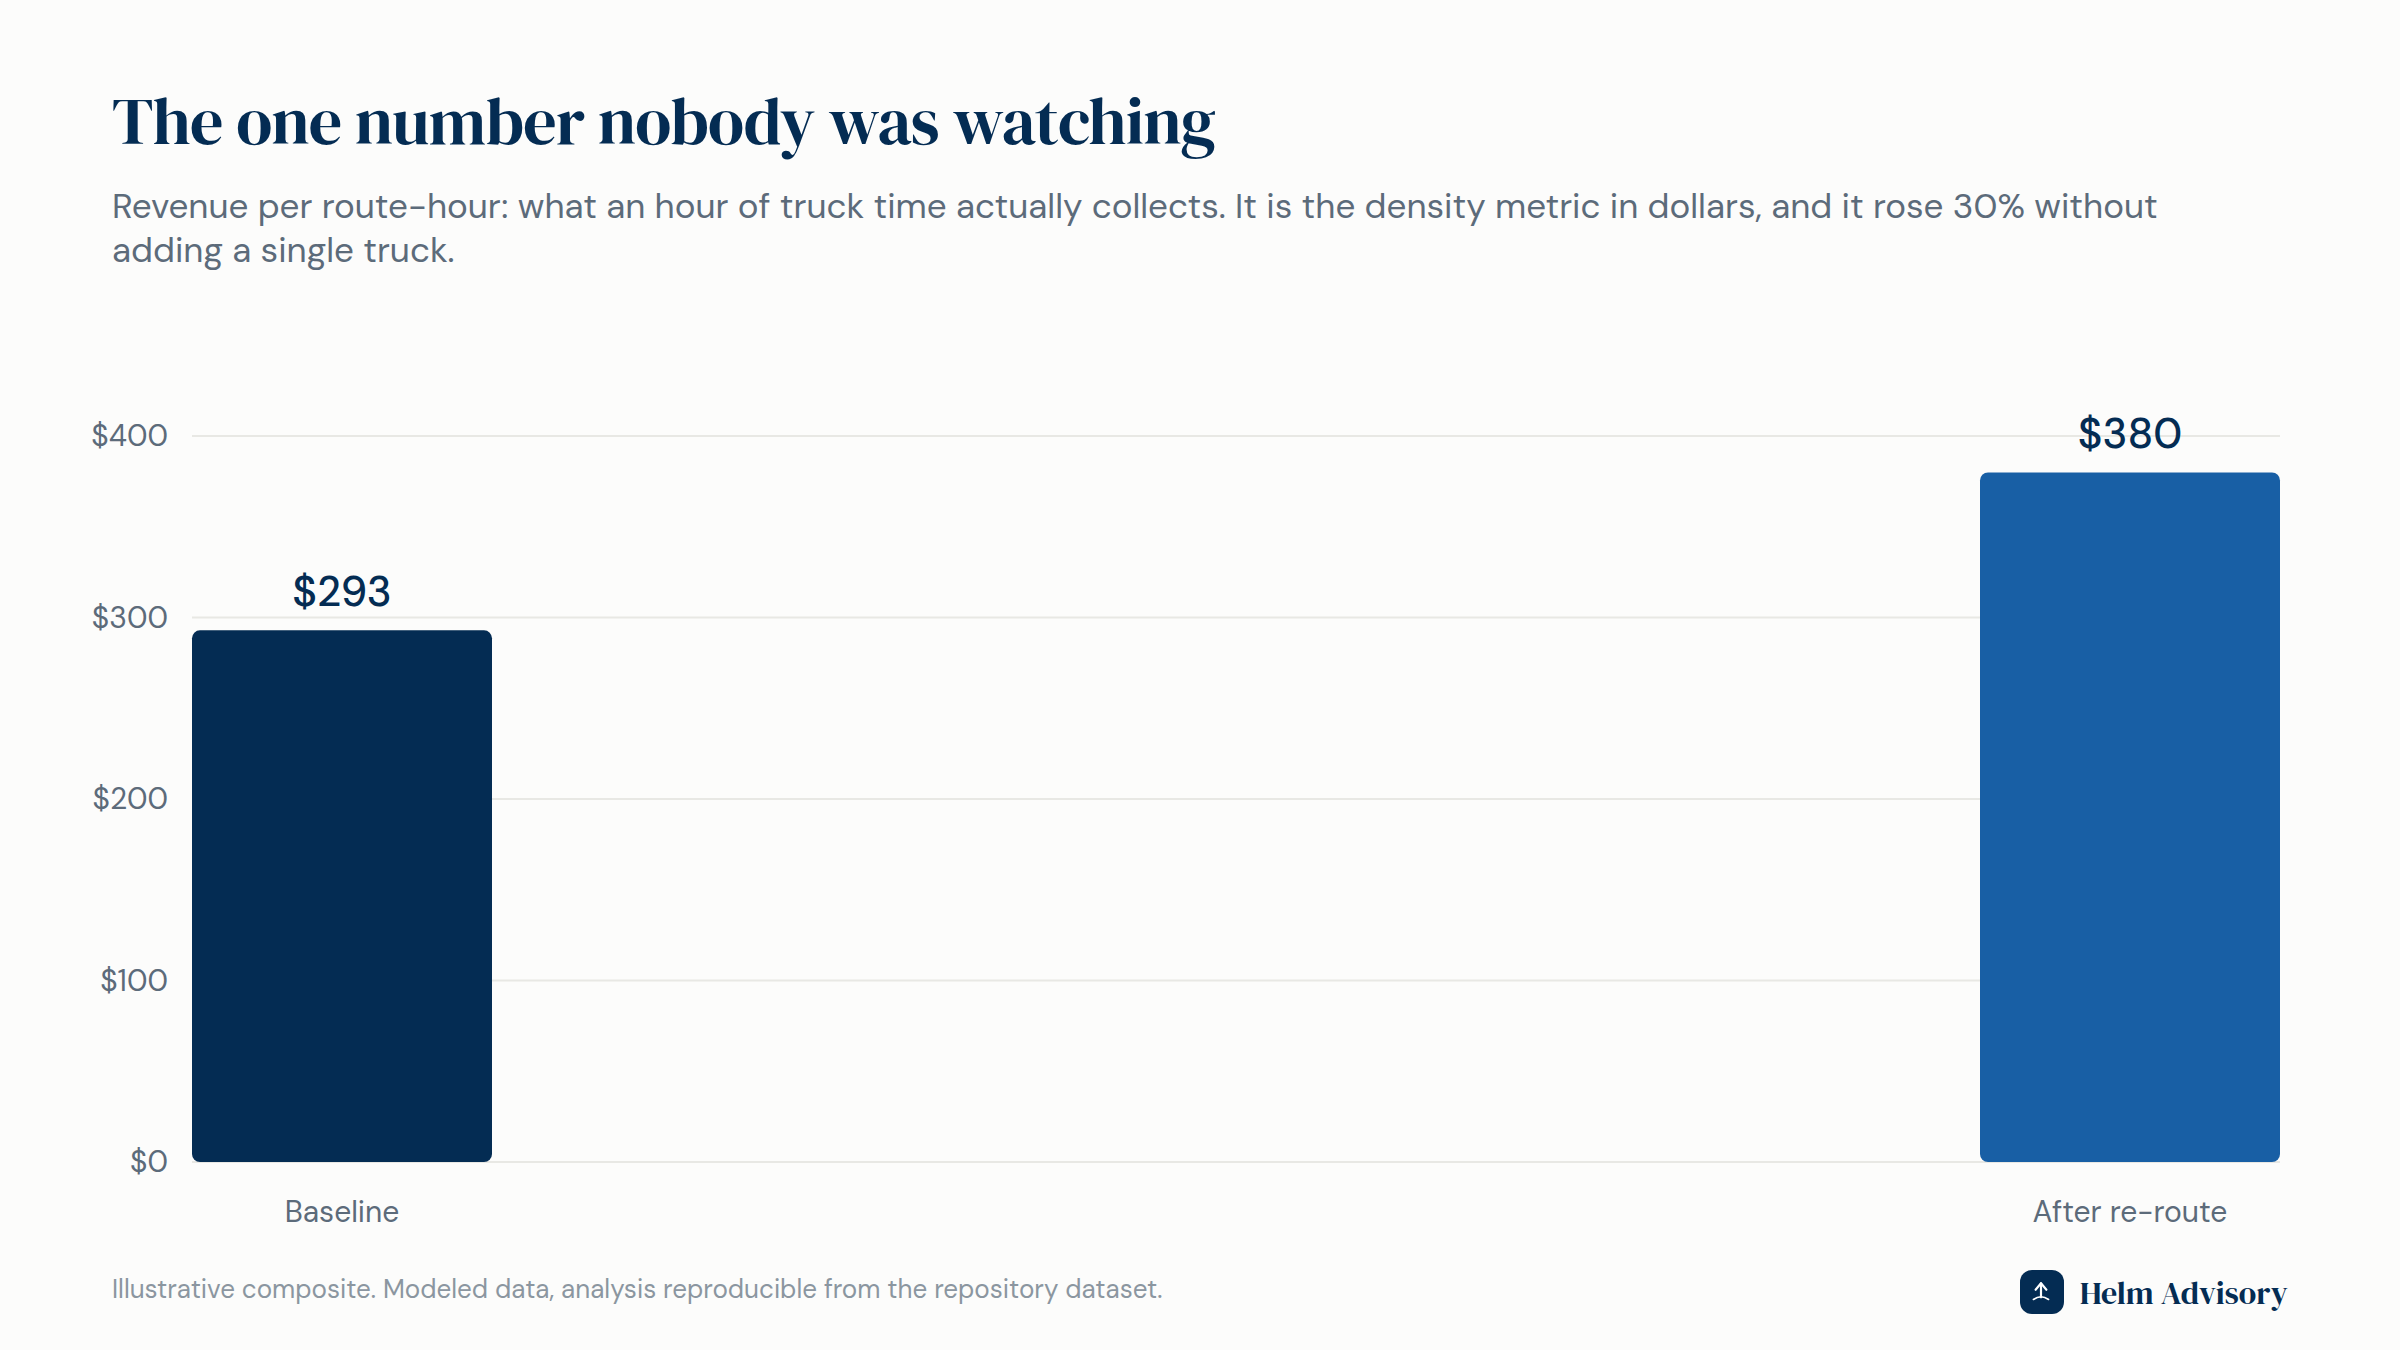
Revenue per route-hour rose 30%, from $293 to $380, without adding a single truck. EBITDA margin went from 6.4% to 15.9%. The business got smaller in trucks and larger in profit, which is exactly what density discipline does.
The exit angle
Route-based businesses are bought and sold on route density and contract quality. A hauler running at $380 per route-hour with clean, escalating contracts is worth materially more than one running at $293 with a book full of underwater stops and unbilled escalators, even at similar revenue. The operating work and the value work are the same work, and it plugs directly into how we serve waste and recycling operators.
Curious what your own routes actually earn? Start a conversation, or take the two-minute Exit-Readiness Scorecard.
Methodology: modeled route-level data (stops, miles, hours, revenue, and fully loaded cost per route) plus 40 commercial contracts with escalator terms. All figures computed from the dataset; the EBITDA bridge reconciles. Composite prepared so the mechanics can be shown with a specificity confidential client work does not allow.