About this case study. Hartwell is an illustrative composite and its operating data is modeled, because our client work is confidential. The analysis is real: every number on this page is computed from a full 24-month dataset, and the EBITDA bridge reconciles to the dollar. The pattern is one we see in real shops.
The results, up front
| Measure | Year 1 | Year 2 | Change |
|---|---|---|---|
| Revenue | $14.51M | $17.14M | +18% |
| EBITDA | $2.16M | $3.58M | +$1.42M (+66%) |
| EBITDA margin | 14.9% | 20.9% | +6.0 pts |
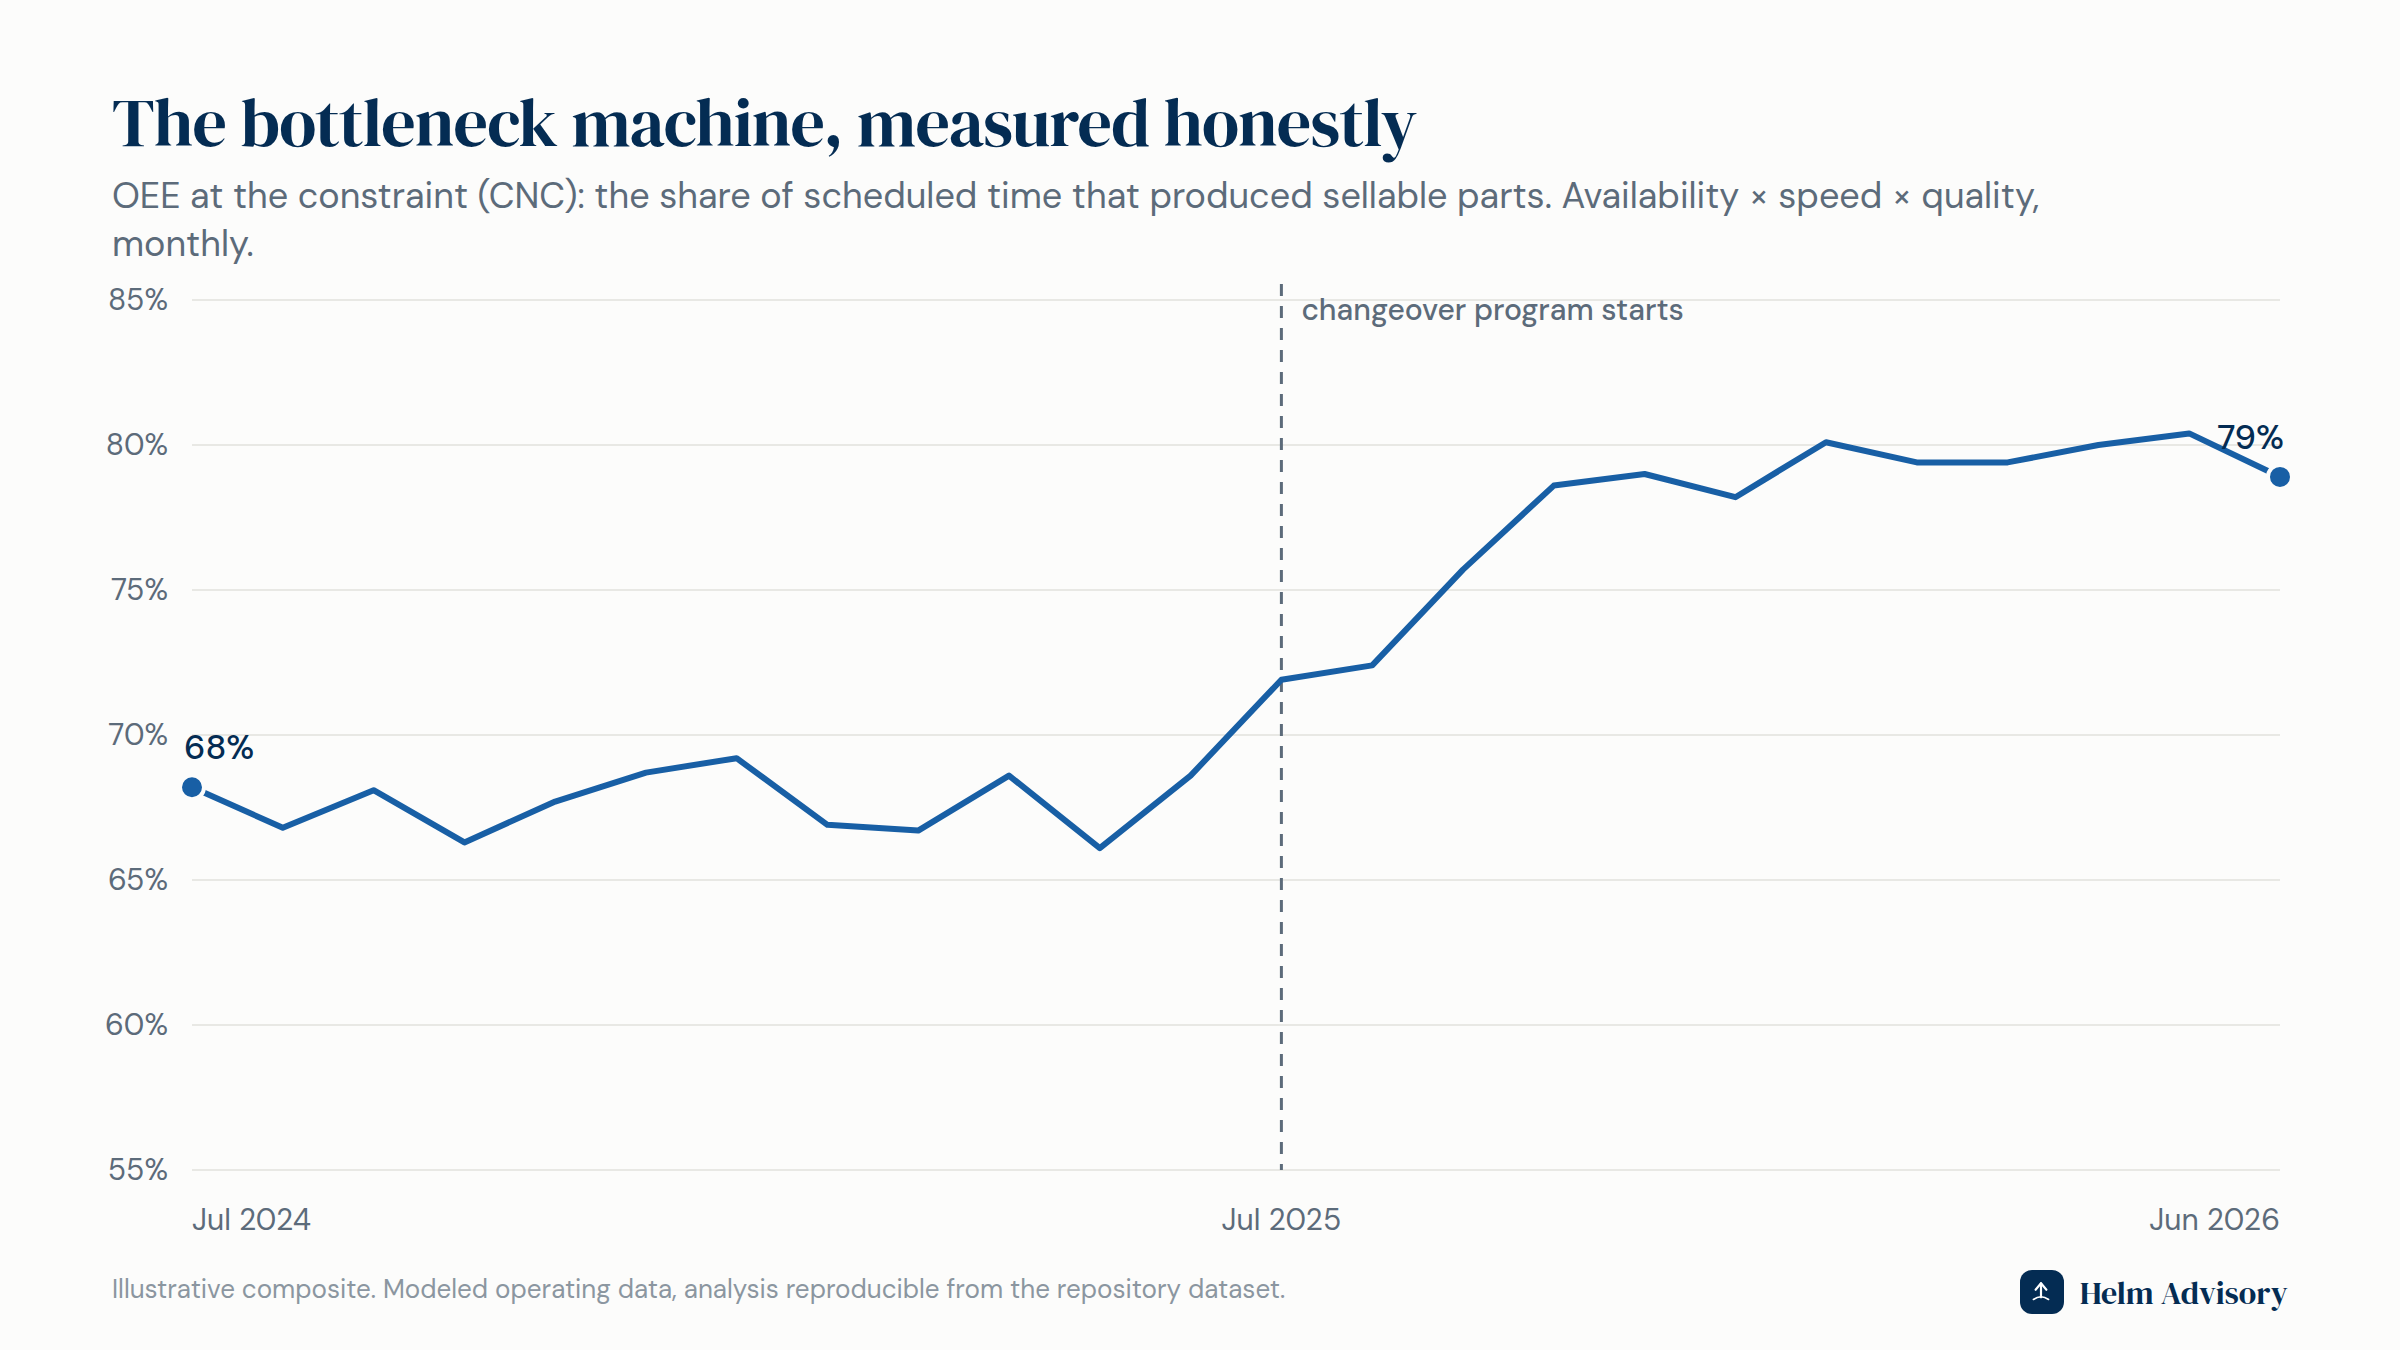
| Uptime quality (OEE) at the bottleneck | 67.7% | 77.8% | +10.1 pts |
| Changeover time at the bottleneck | 13.3% of hours | 7.9% | cut by 41% |
| Scrap at the bottleneck | 5.1% | 2.6% | cut in half |
| Price collected vs list | 95.8% | 97.1% | +1.3 pts |
| Headcount | 52 | 52 | no layoffs |
The company
Hartwell is a second-generation, family-owned precision components shop. $14.5M in revenue, 52 people, three work centers: CNC machining, fabrication and welding, and finishing and assembly. Healthy demand, a six-week quoted lead time, and a backlog they were quietly turning away.
The symptom
The owner's question on the first call was about layoffs. Margins had drifted down for two years, the ERP said labor was the biggest controllable cost, and finishing looked overstaffed. The plan on the table was to cut four people.
The P&L genuinely supported that plan. That is the trap. A P&L can tell you a cost is high. It cannot tell you why, and it cannot see the plant.
What the data showed
The first month went to connecting the operating data to the financials: hours by work center, changeover and breakdown time, scrap, units, and the price actually collected by product family. Three things fell out.
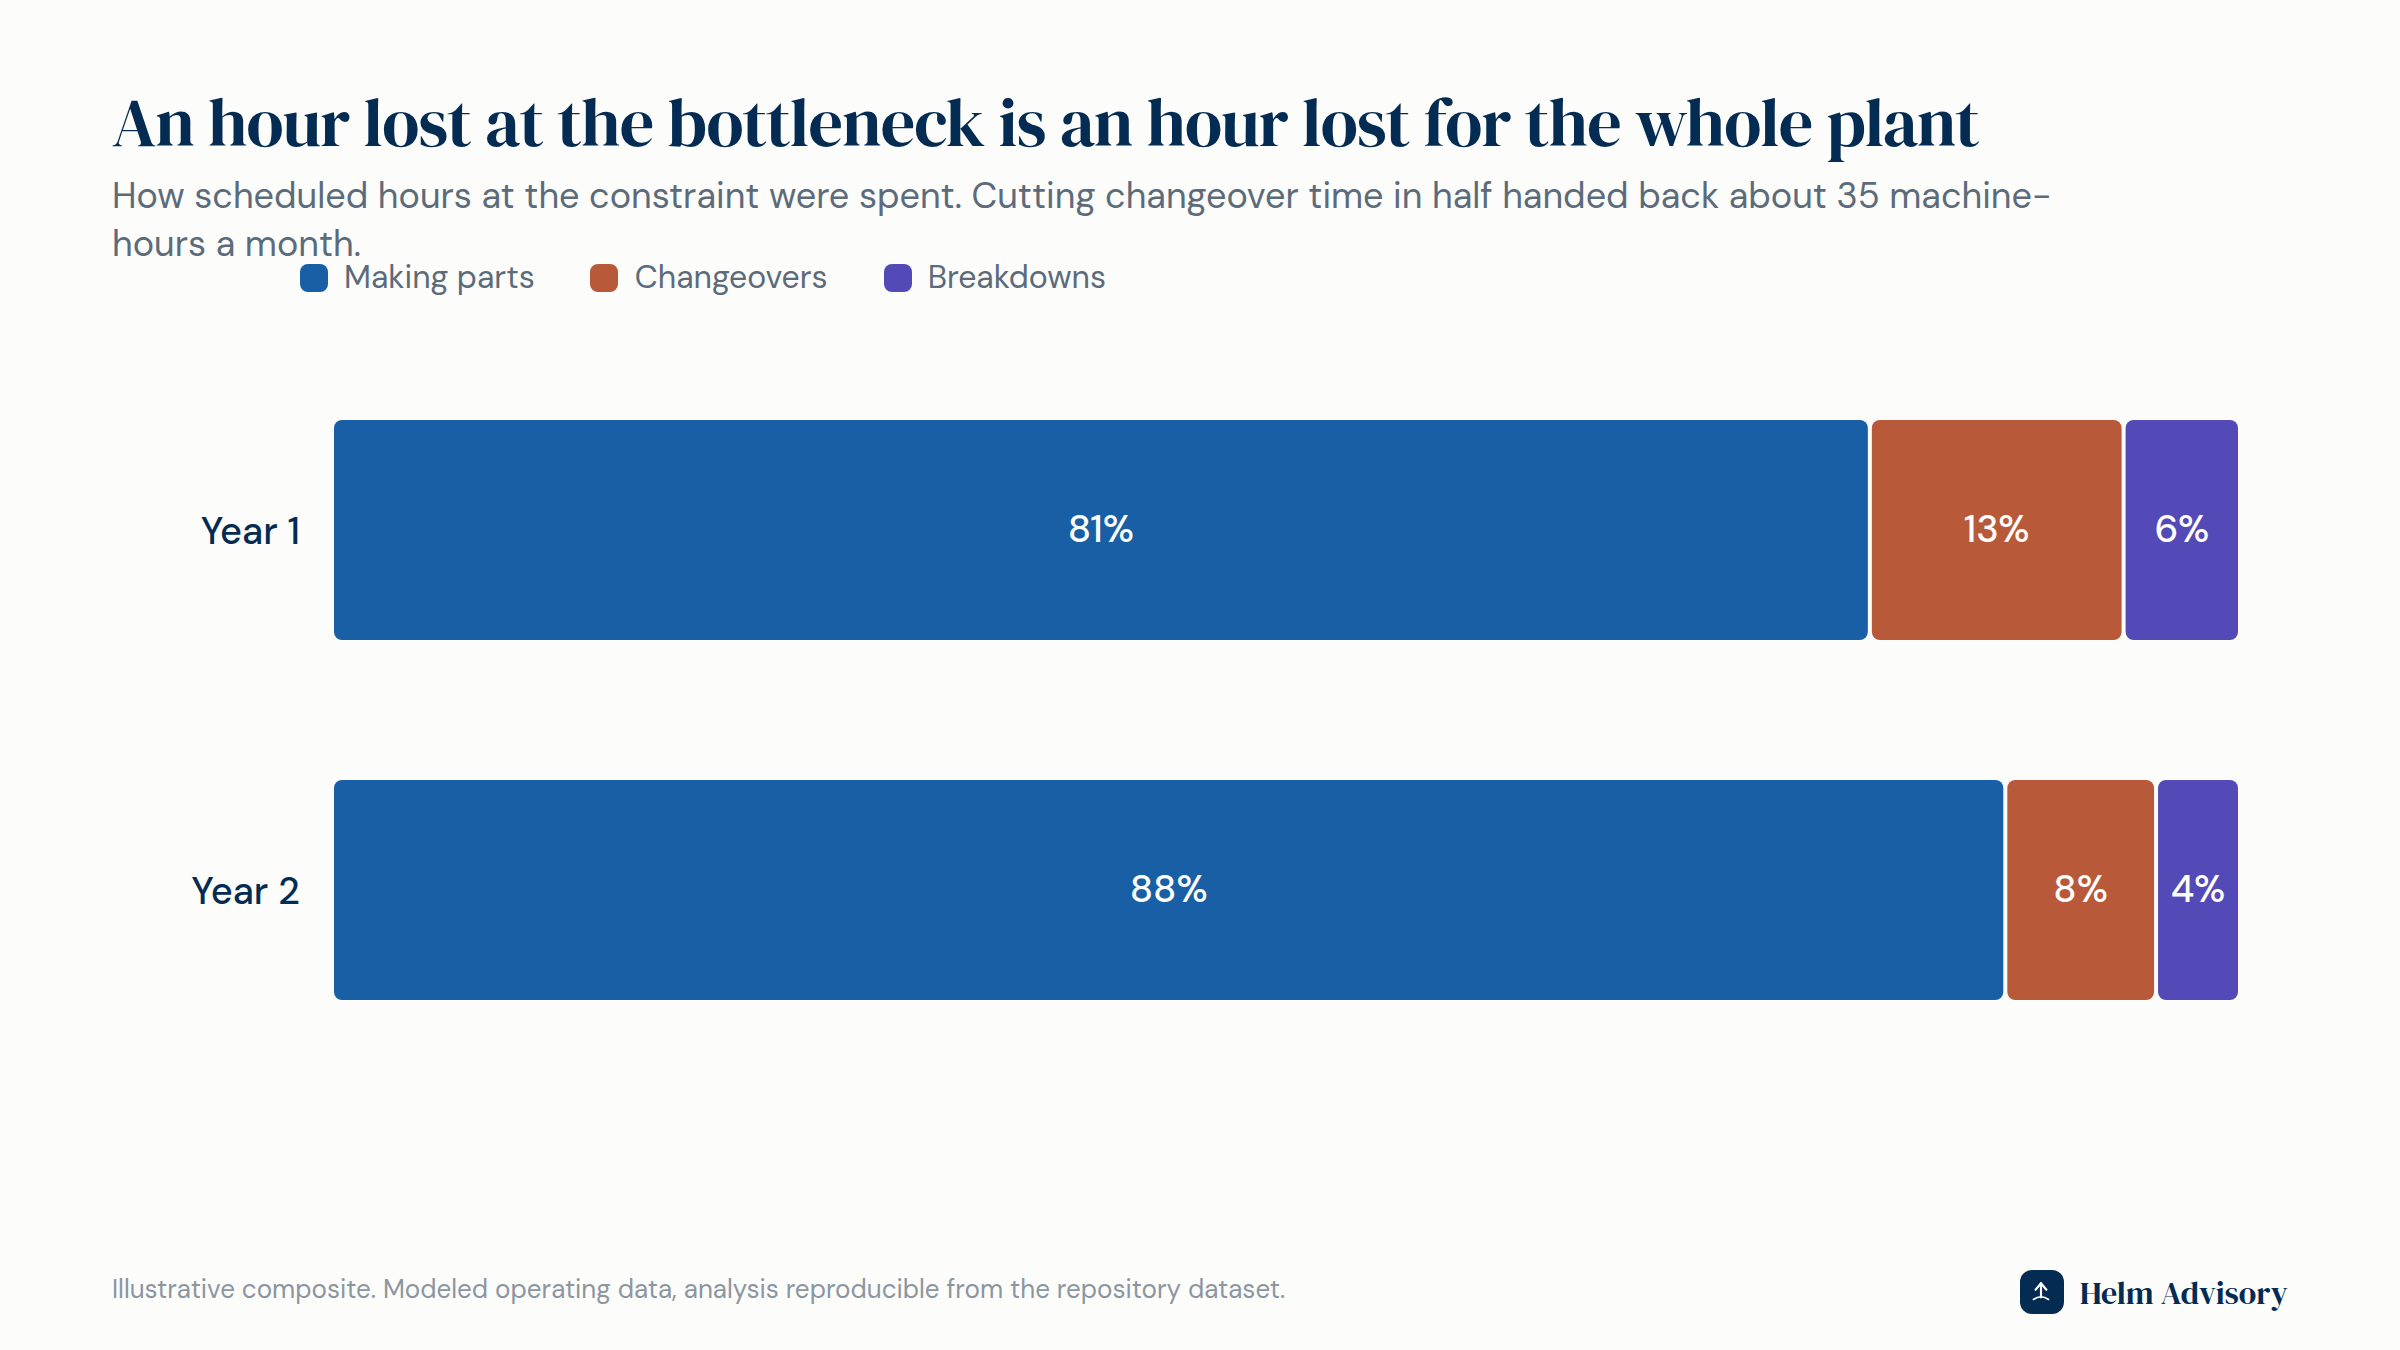
The plant had one real problem, and it was not labor. The CNC work center was the bottleneck. It paced everything, and it turned scheduled time into good parts only 67.7% of the time. Changeovers alone ate 13.3% of its hours. Finishing was not overstaffed. It was starved, sitting idle waiting on parts, which made its labor look wasteful on paper.
The idea in plain terms, from a book every operations MBA reads (The Goal): a factory is a chain, and a chain moves at the speed of its slowest link. An hour lost at the bottleneck is an hour of output lost for the entire plant, forever. An hour saved anywhere else is a mirage. The layoff plan would have cut cost at a starved step while leaving the thing limiting the whole business untouched.
Each bottleneck hour was worth $1,199. Revenue minus material, divided by the constraint's run hours. That one number changed every argument in the building. A $60-per-hour operator doing setup prep so the machine never waits is not a cost. The machine's hours are what the company actually sells.
The price file was leaking. One product family had been priced cost-plus in 2019 and never revisited. Across the book, discounts meant Hartwell collected only 95.8 cents of every list-price dollar.
What changed
Four moves, in order of leverage.
- Pit-crew changeovers. Watch a race team: the tires are out and the tools staged before the car stops. The same discipline at the CNC moved every setup task that could be done while the machine was still cutting outside the stop. Changeover time fell from 13.3% to 7.9% of scheduled hours, handing back about 35 machine-hours a month.
- Schedule to the bottleneck. The CNC never waits, never runs out of material, never does work the plant does not need. Preventive maintenance got scheduled around it and breakdown time fell too.
- A scrap program where scrap mattered. Bottleneck scrap is the most expensive scrap in the building because it destroys constraint hours along with material. It fell from 5.1% to 2.6%.
- Collect the price already on the sheet. The stale family was repriced 4% after seven years flat, and discounting got rules. Realization rose to 97.1% of list.
What happened
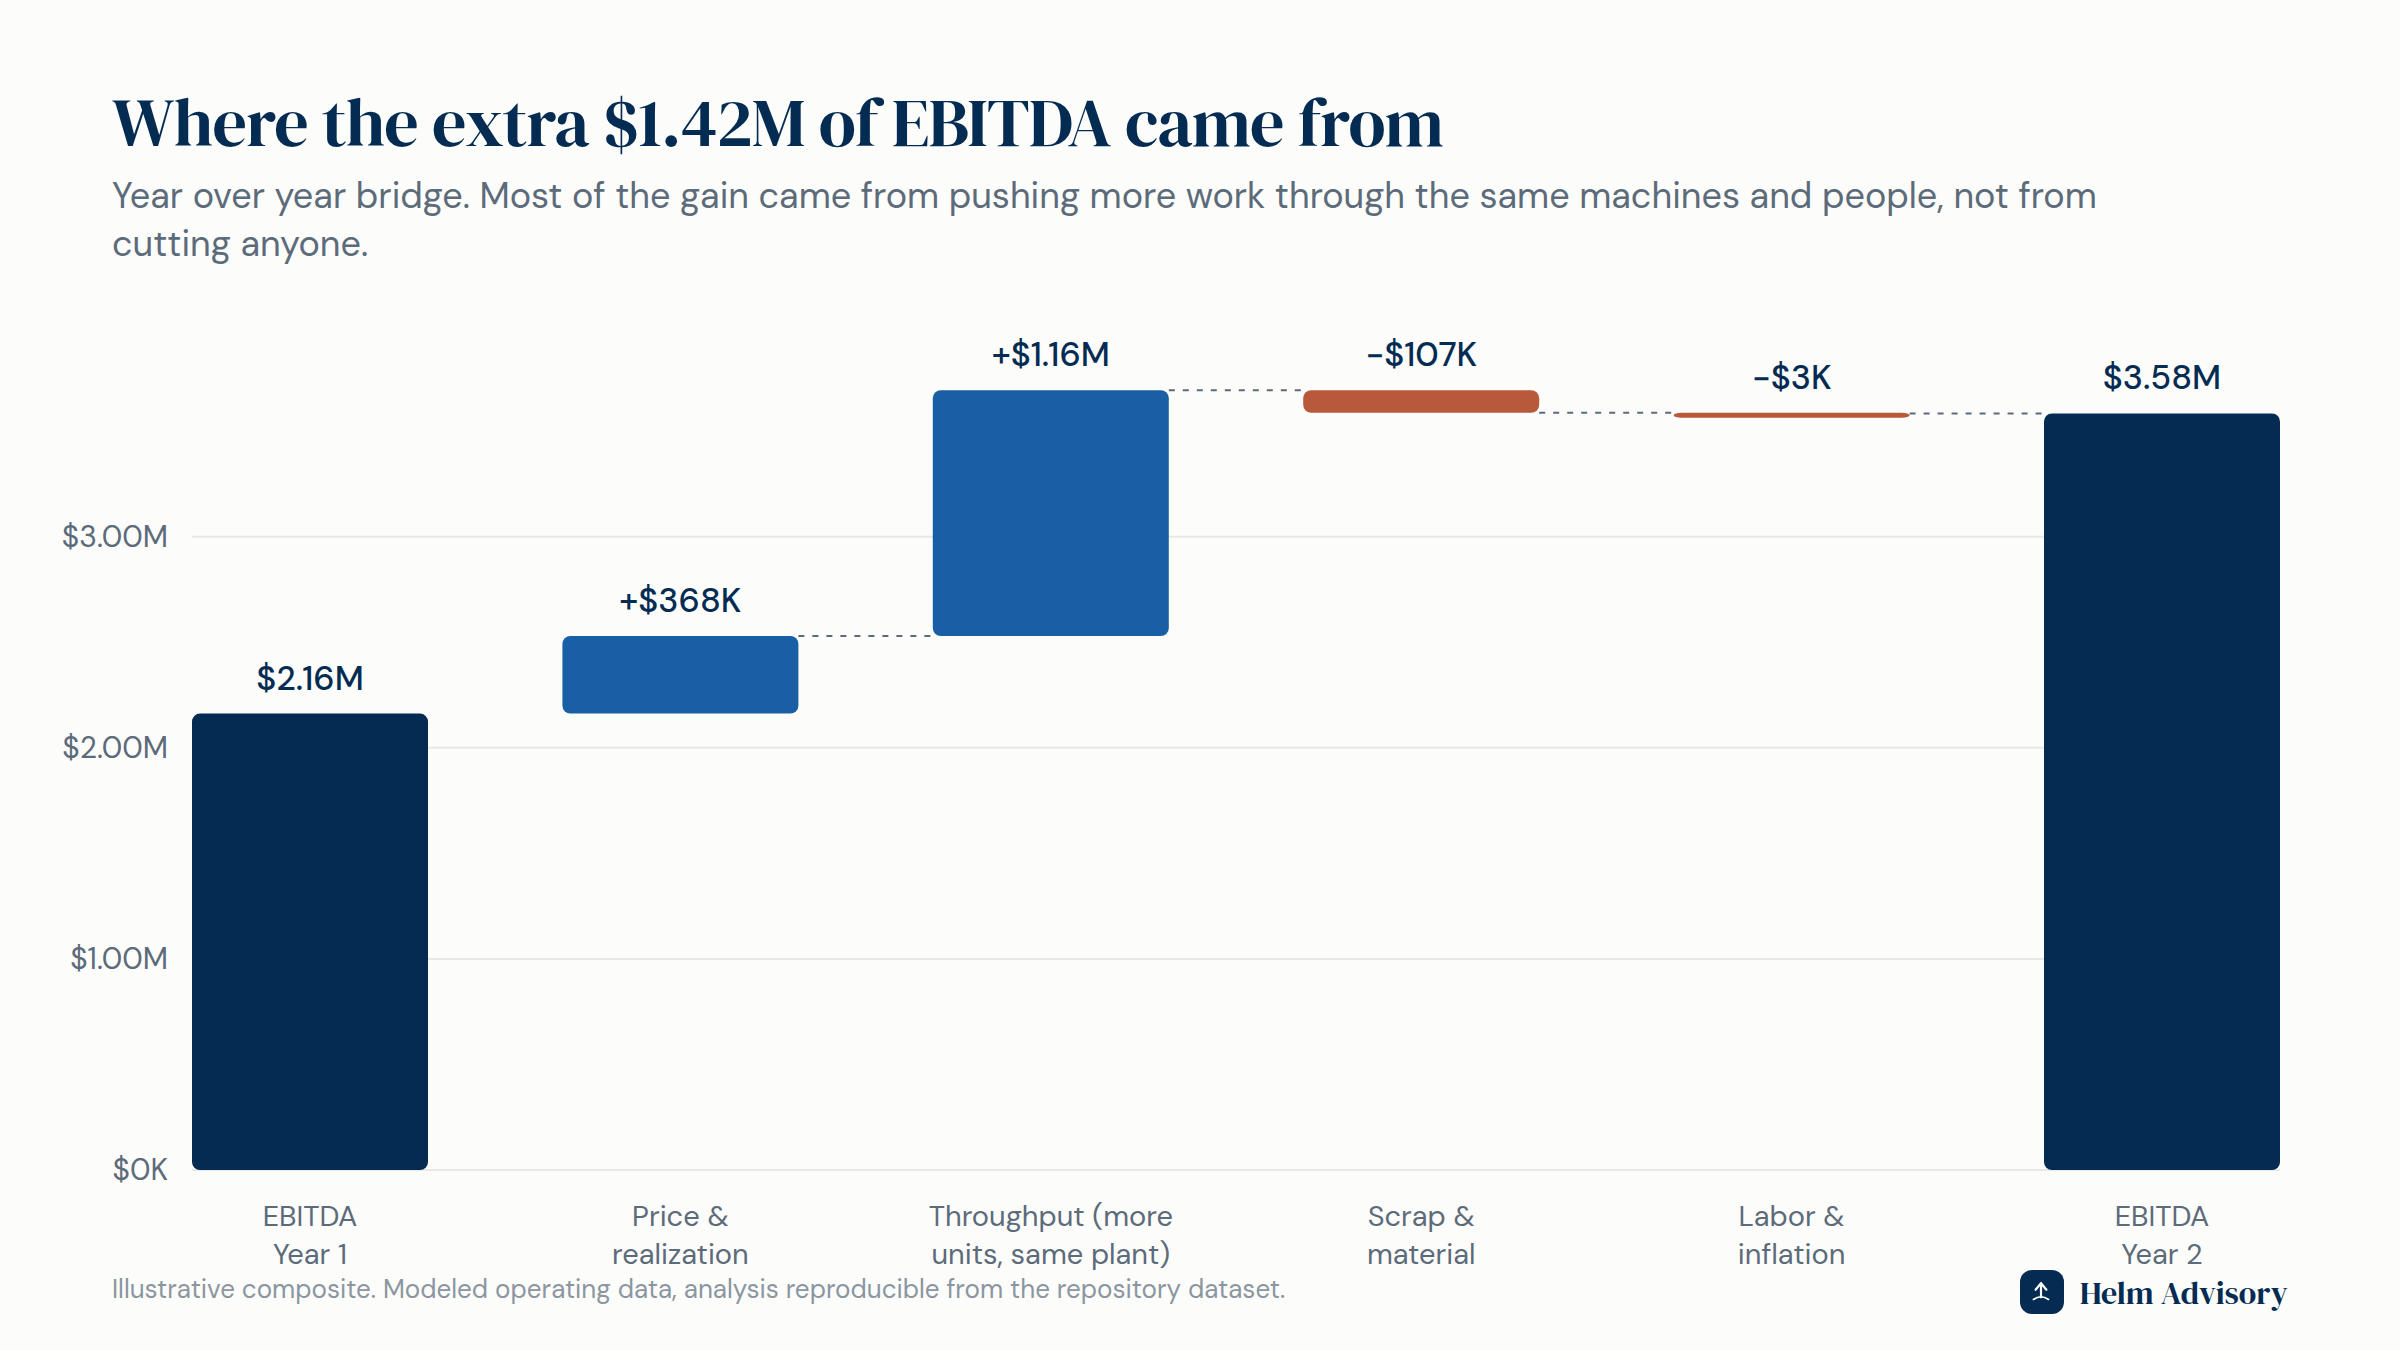
The freed bottleneck hours turned the quoted-away backlog into shipments: 16% more units through the same machines and the same 52 people. Of the $1.42M EBITDA gain, $1.16M is throughput on a fixed cost base, $368K is price, and the rest is scrap savings net of inflation.
The four finishing employees who were about to be cut spent the year absorbing the higher volume.
The exit angle
A buyer values a business like this on EBITDA times a multiple. The same company, two years apart, at the same 5x multiple: $10.8M of enterprise value became $17.9M. None of it came from a new product, a new customer, or a capital project. It came from running the plant the business already owned, on purpose.
If a sale or transition is anywhere on your horizon, the operational work and the valuation work are the same work. That is the case for putting a CFO and COO in one seat, and it is what the Exit-Readiness Scorecard measures in two minutes.
Methodology: 24 months of modeled monthly operating and pricing data; months 1 to 12 are the baseline year, 13 to 24 the engagement year. All figures are computed from the dataset and the EBITDA bridge reconciles exactly. Composite prepared so the mechanics can be shown with a specificity confidential client work does not allow.