About this case study. Bluffline is an illustrative composite and its operating data is modeled, because our client work is confidential. The analysis is real: every number on this page is computed from a full dataset of customers, inventory, contracts, and 24 months of working-capital balances. The pattern is one we see in real distributors.
The results, up front
| Measure | Baseline | 12 months later | Change |
|---|---|---|---|
| Cash conversion cycle | 116 days | 72 days | 44 days shorter |
| Cash released from working capital | n/a | $2.74M | credit line paid to zero |
| Receivable days (DSO) | 54.3 | 40.8 | 13.5 days faster |
| Inventory days (DIO) | 92.2 | 68.1 | 24 days leaner |
| Payable days (DPO) | 30.2 | 36.6 | 6.4 days of free financing |
| Invoice lag (job done to invoice sent) | 6.4 days | 1.8 days | 4.6 days faster |
| Contract escalators recovered | n/a | $337K per year | pure margin, no price increase |
| Money-losing customers identified | 0 known | 60 of 240 | repriced, restructured, or released |
The company
Bluffline is a regional industrial supply distributor. $28.8M in revenue, three branches, about 9,000 SKUs, 240 active accounts, 64 of them on multi-year contracts. Solidly profitable every single year.
The symptom
The owner put it plainly. "We make money every month and I sweat payroll every month." The credit line was drawn most of the year. Growth made it worse, which felt backwards. Twice a year the bank asked questions that were getting harder to answer.
Profit is an opinion about a period. Cash is what is in the account on Thursday. At Bluffline the gap between the two had a size: 116 days.
What the data showed
A dollar spent stayed trapped for 116 days. Bluffline paid suppliers in about 30 days, held inventory for 92, and collected from customers in 54. Pay early, hold long, collect late: the company was financing everyone else's business with its own credit line.
The idea in plain terms, and it is the metric Amazon is built on: the cash conversion cycle is how many days pass between paying for a thing and getting paid for it. Amazon famously runs it negative, collecting your money before it pays its supplier, so growth generates cash. A distributor will not get to negative. But every day cut from the cycle is real cash handed back, permanently. At Bluffline's volume, one day was worth roughly $60K.
Six of those days were pure sloppiness. The average invoice went out 6.4 days after the goods shipped. Nobody decided that. Tickets waited on approvals; approvals waited on Fridays. Customers cannot pay an invoice that has not been sent.
38% of the inventory was insurance nobody priced. Sorting 9,000 SKUs by how fast they actually move put 38% of the inventory dollars in the slowest class, turning 0.7 times a year. Inventory is cash wearing a warehouse coat, and a third of Bluffline's cash was standing very still.
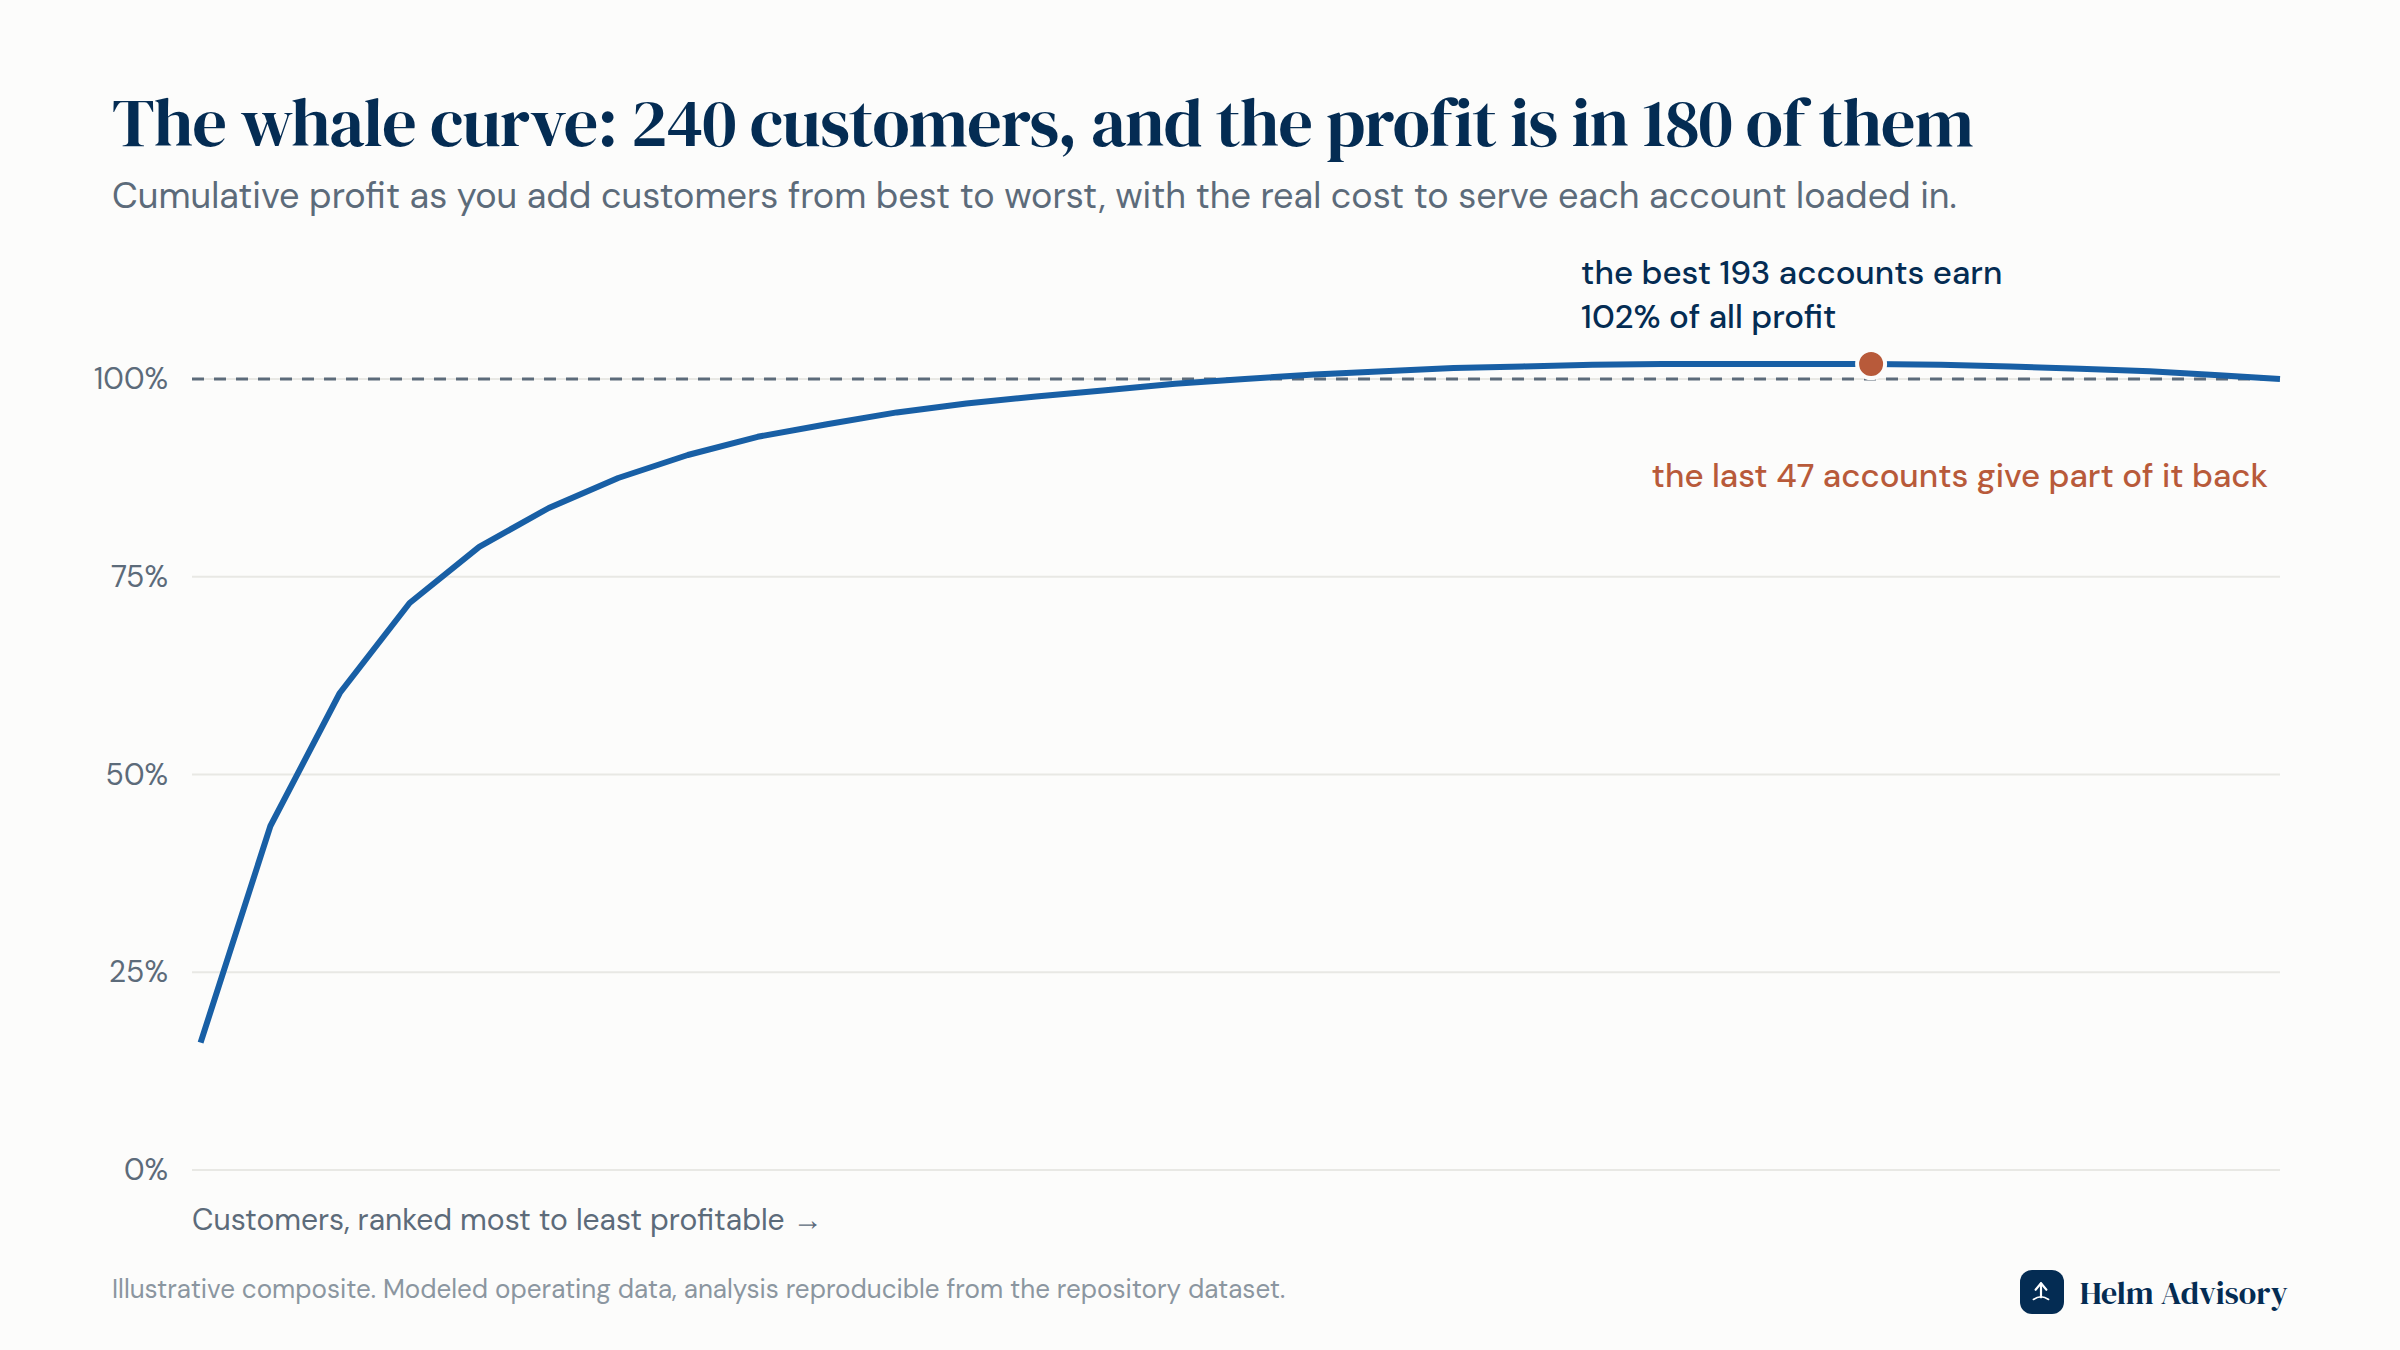
60 of 240 customers lost money. Two accounts with identical revenue are not identical. One orders weekly in clean quantities and pays in 35 days. The other orders daily in small lots, returns 3% of everything, demands rush service, and pays in 70. Loading the real cost to serve onto each account showed the bottom 38% of customers contributed negative profit in aggregate.
$337K a year was sitting in contracts, unbilled. Of 64 contracts with CPI escalators or surcharges, 22 had never had the last escalation applied. That money required no negotiation. It was already agreed to, in writing, by the customer.
What changed
- Invoice the day the job ships. Ticket-to-invoice discipline with a daily exception report. Lag fell from 6.4 days to 1.8.
- A collections cadence, not collections heroics. Statements on a schedule, calls on a trigger, terms enforced. DSO fell from 54 to 41 without losing a top-50 account.
- Reorder points and a freeze on the dead class. Fast movers got stocked deeper, so service improved while the slow class worked down. Inventory days fell from 92 to 68.
- Supplier terms negotiated, not stretched. Volume consolidated to fewer vendors in exchange for 36-day terms, paid on time every time. That is why they said yes.
- The escalator true-up. Every contract inventoried, every clause compared to actual invoices, every escalator given an owner and a calendar date.
- The tail worked in order. Reprice first, fix how the account is served second, release last. Most of the 60 stayed, at terms that work.
What happened
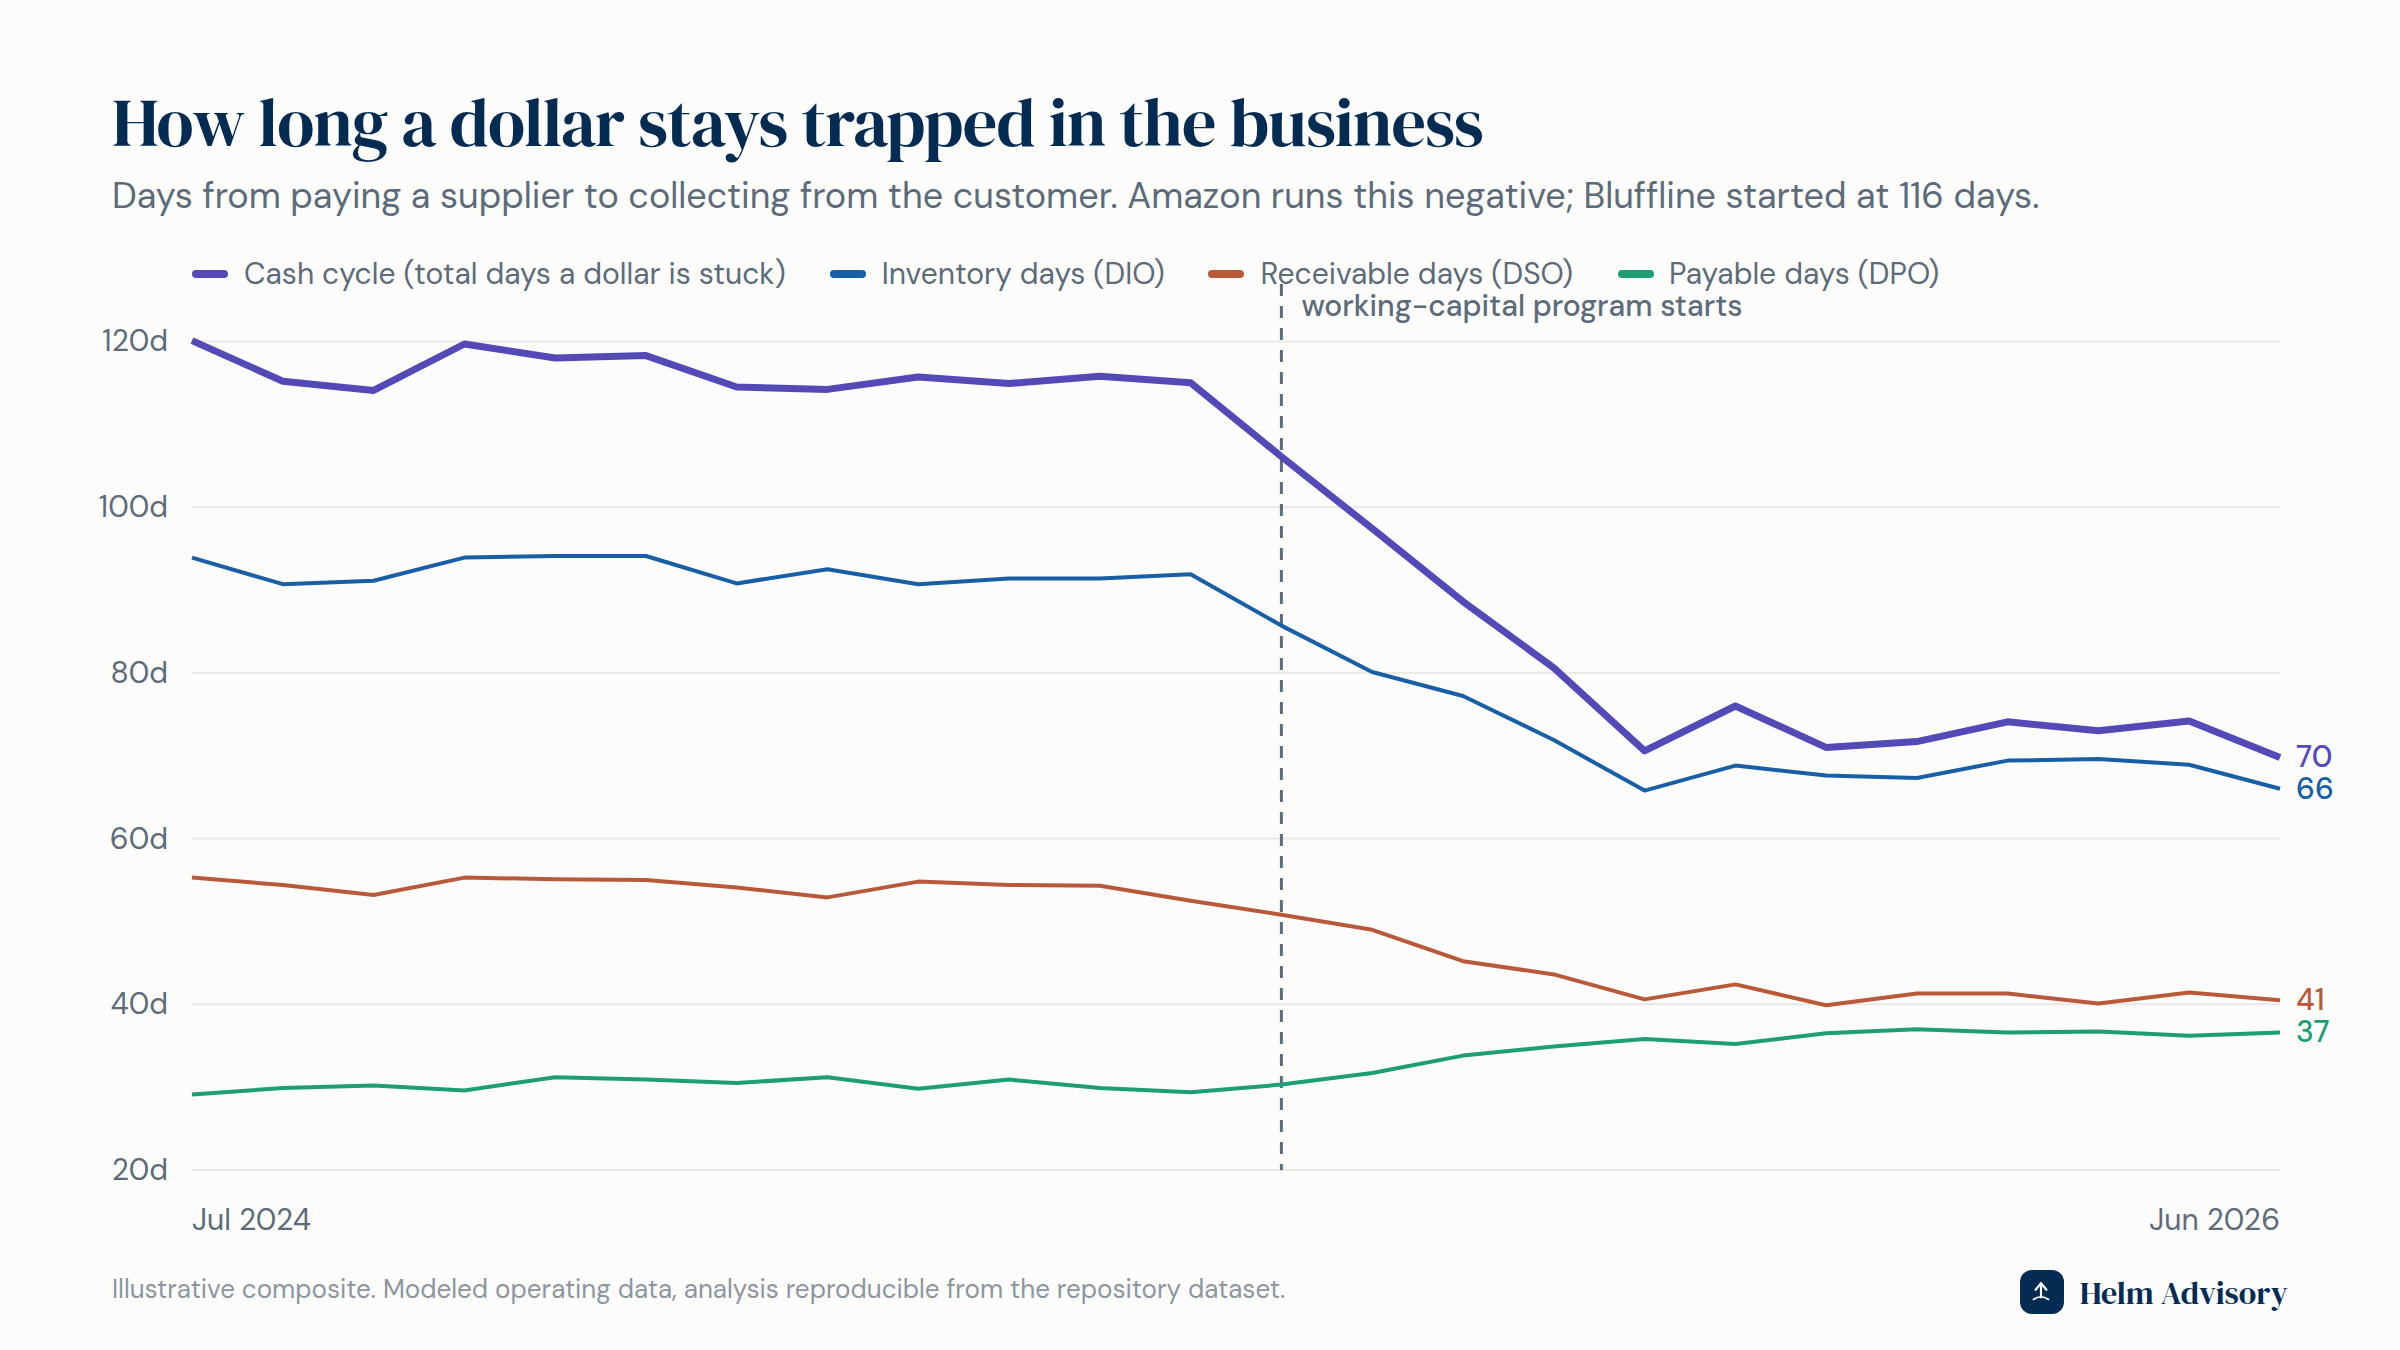
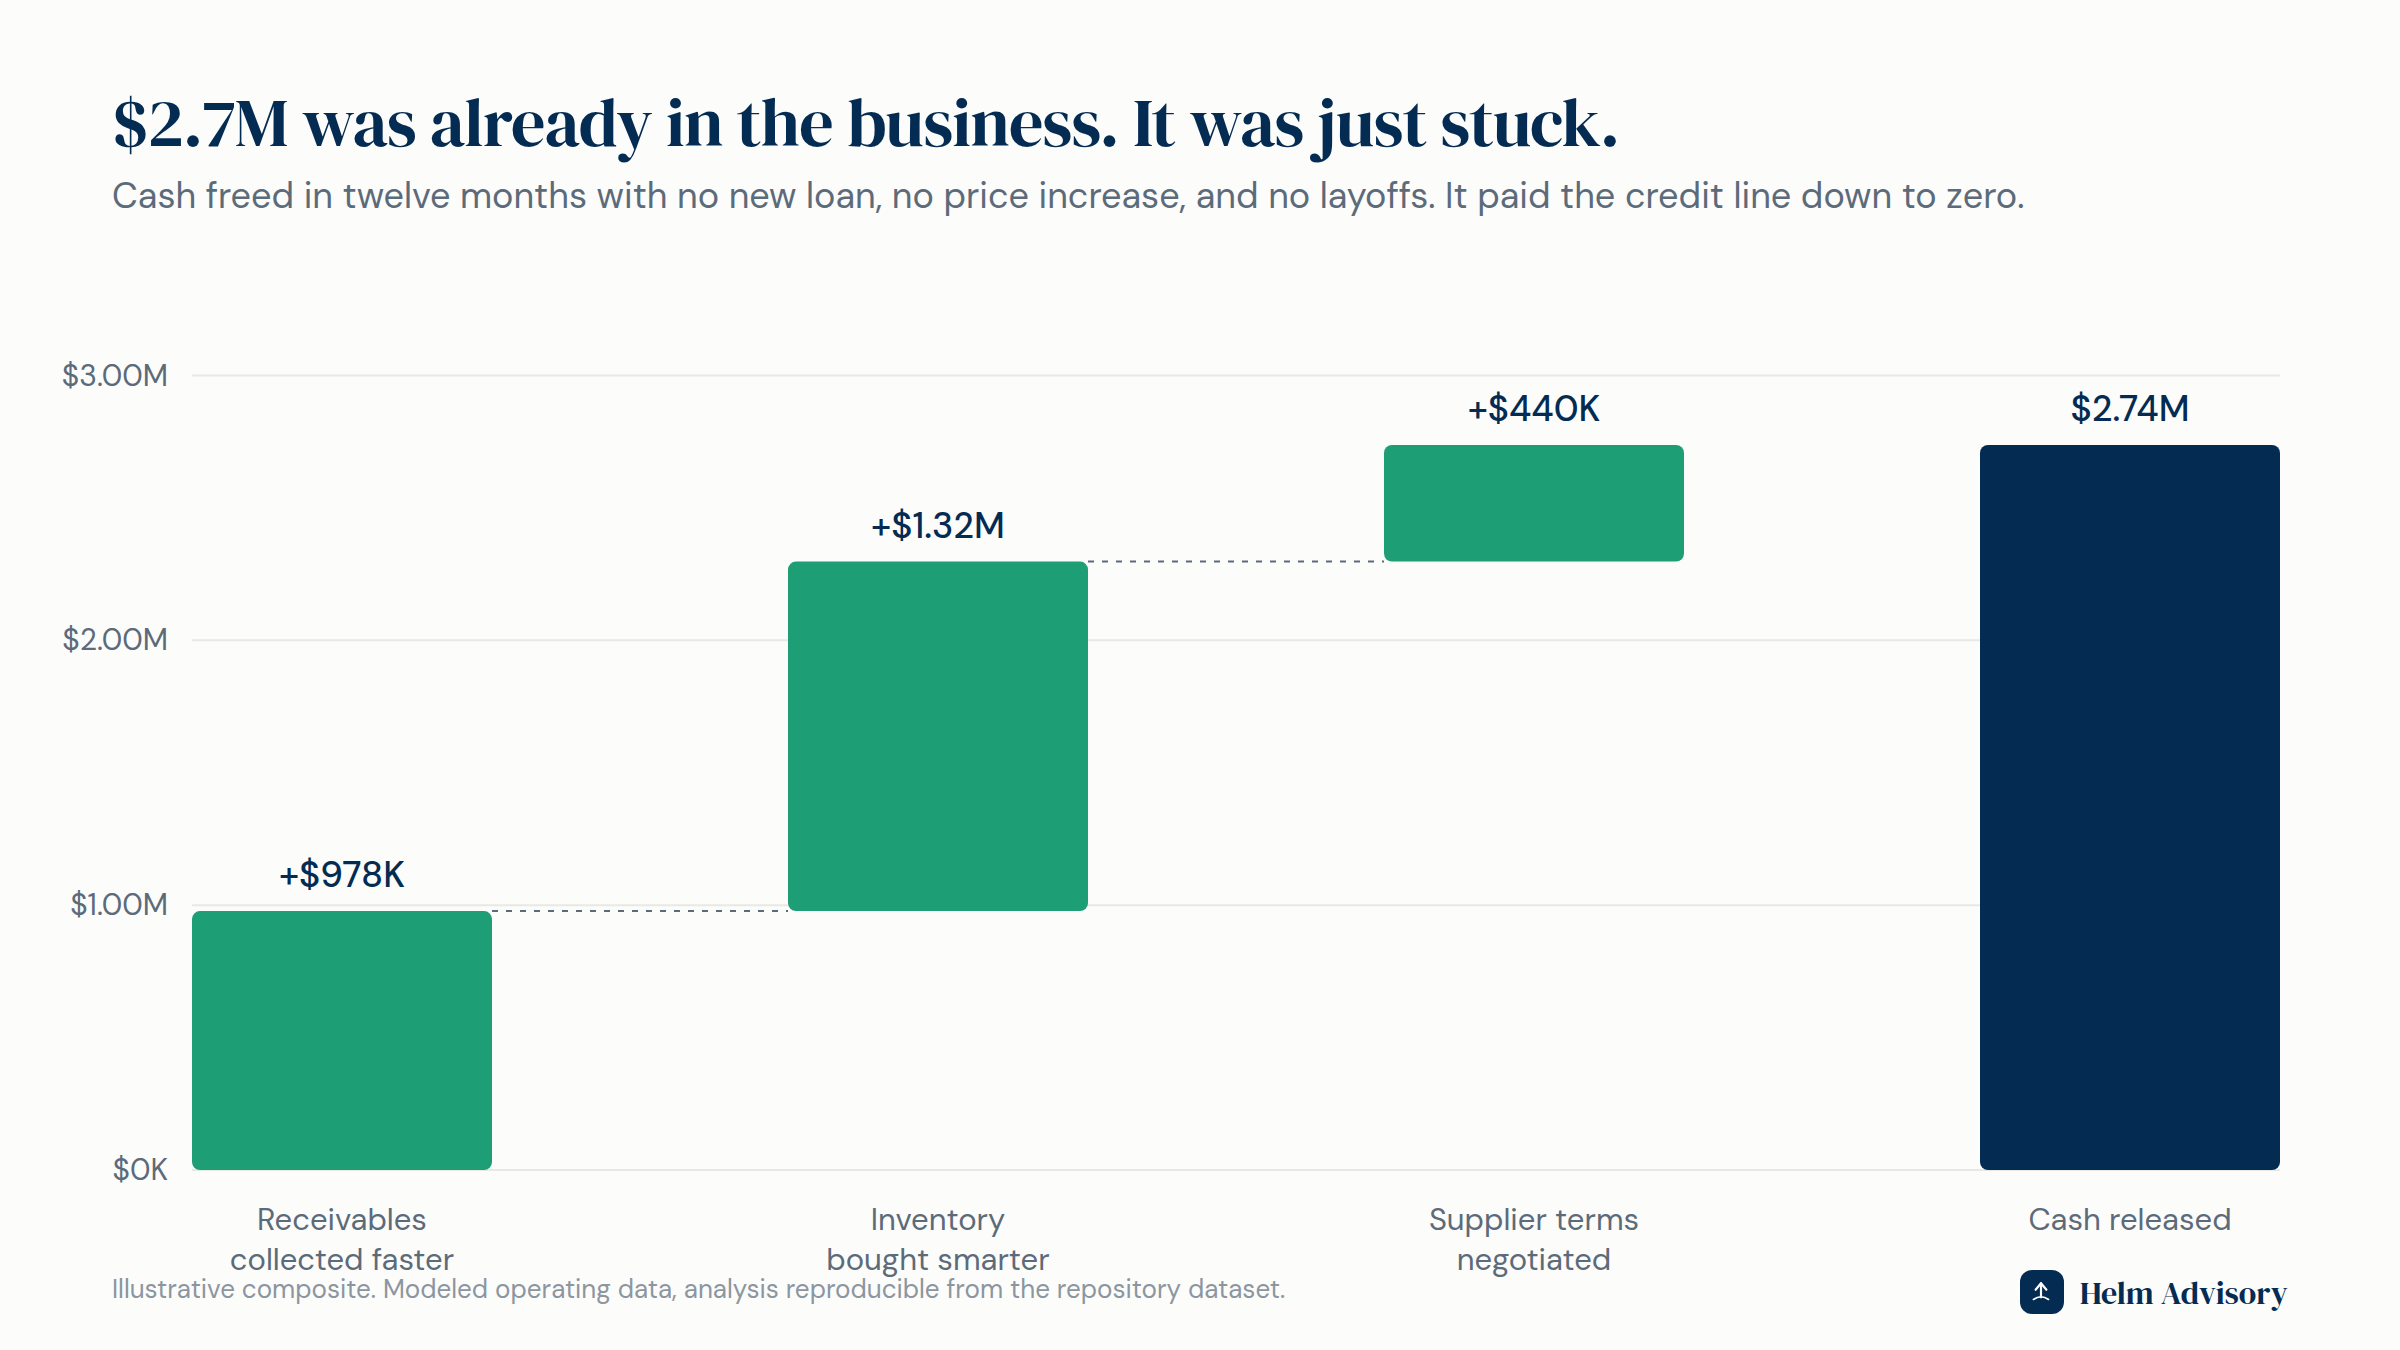
The cycle fell from 116 days to 72, releasing $2.74M: $978K from receivables, $1.32M from inventory, $440K from supplier terms. The credit line went to zero, removing roughly $250K a year of interest. The escalator recovery added $337K of margin that now arrives every year.
No price increase. No layoffs. No new debt.
The exit angle
Working capital is one of the first things a buyer's diligence team models, because they fund it the day after closing. A distributor that runs at 72 days instead of 116 needs $2.7M less capital to own, shows cleaner receivables and inventory in a quality-of-earnings review, and carries a customer book whose margins are real rather than propped up by hidden cross-subsidies. The same fixes that ended the Thursday sweat made the company measurably easier, and more valuable, to buy.
Want to know where your own cash is hiding? Start with the Exit-Readiness Scorecard, or read how we approach the CFO seat in operations-heavy businesses.
Methodology: modeled data covering 240 customers with cost-to-serve drivers, 9,000 SKUs in velocity classes, 64 contracts with escalator terms, and 24 months of working-capital balances. All figures computed from the dataset. Interest savings assume the released cash retires a fully drawn line at prevailing rates. Composite prepared so the mechanics can be shown with a specificity confidential client work does not allow.